Estimated Value: $313,000 - $377,000
2
Beds
2
Baths
1,543
Sq Ft
$229/Sq Ft
Est. Value
About This Home
This home is located at 151 S Stringtown Rd, Xenia, OH 45385 and is currently estimated at $352,900, approximately $228 per square foot. 151 S Stringtown Rd is a home located in Greene County with nearby schools including Xenia High School.
Ownership History
Date
Name
Owned For
Owner Type
Purchase Details
Closed on
Jan 29, 2004
Sold by
Countrytyme Lebanon Ltd
Bought by
Robbins Paul R and Robbins Mary J
Current Estimated Value
Home Financials for this Owner
Home Financials are based on the most recent Mortgage that was taken out on this home.
Original Mortgage
$36,804
Interest Rate
5.88%
Mortgage Type
Unknown
Purchase Details
Closed on
Dec 30, 2003
Sold by
Galloway Land Co
Bought by
Countrytyme Lebanon Ltd
Home Financials for this Owner
Home Financials are based on the most recent Mortgage that was taken out on this home.
Original Mortgage
$36,804
Interest Rate
5.88%
Mortgage Type
Unknown
Create a Home Valuation Report for This Property
The Home Valuation Report is an in-depth analysis detailing your home's value as well as a comparison with similar homes in the area
Home Values in the Area
Average Home Value in this Area
Purchase History
| Date | Buyer | Sale Price | Title Company |
|---|---|---|---|
| Robbins Paul R | $45,000 | -- | |
| Countrytyme Lebanon Ltd | -- | -- |
Source: Public Records
Mortgage History
| Date | Status | Borrower | Loan Amount |
|---|---|---|---|
| Previous Owner | Robbins Paul R | $144,000 | |
| Previous Owner | Robbins Paul R | $143,400 | |
| Previous Owner | Robbins Paul R | $36,804 |
Source: Public Records
Tax History Compared to Growth
Tax History
| Year | Tax Paid | Tax Assessment Tax Assessment Total Assessment is a certain percentage of the fair market value that is determined by local assessors to be the total taxable value of land and additions on the property. | Land | Improvement |
|---|---|---|---|---|
| 2024 | $4,165 | $94,550 | $23,020 | $71,530 |
| 2023 | $3,967 | $94,550 | $23,020 | $71,530 |
| 2022 | $3,397 | $70,150 | $21,260 | $48,890 |
| 2021 | $3,438 | $70,150 | $21,260 | $48,890 |
| 2020 | $3,185 | $70,150 | $21,260 | $48,890 |
| 2019 | $3,126 | $65,430 | $18,700 | $46,730 |
| 2018 | $3,137 | $65,430 | $18,700 | $46,730 |
| 2017 | $3,038 | $65,430 | $18,700 | $46,730 |
| 2016 | $3,039 | $62,820 | $16,570 | $46,250 |
| 2015 | $2,966 | $62,820 | $16,570 | $46,250 |
| 2014 | $2,845 | $62,820 | $16,570 | $46,250 |
Source: Public Records
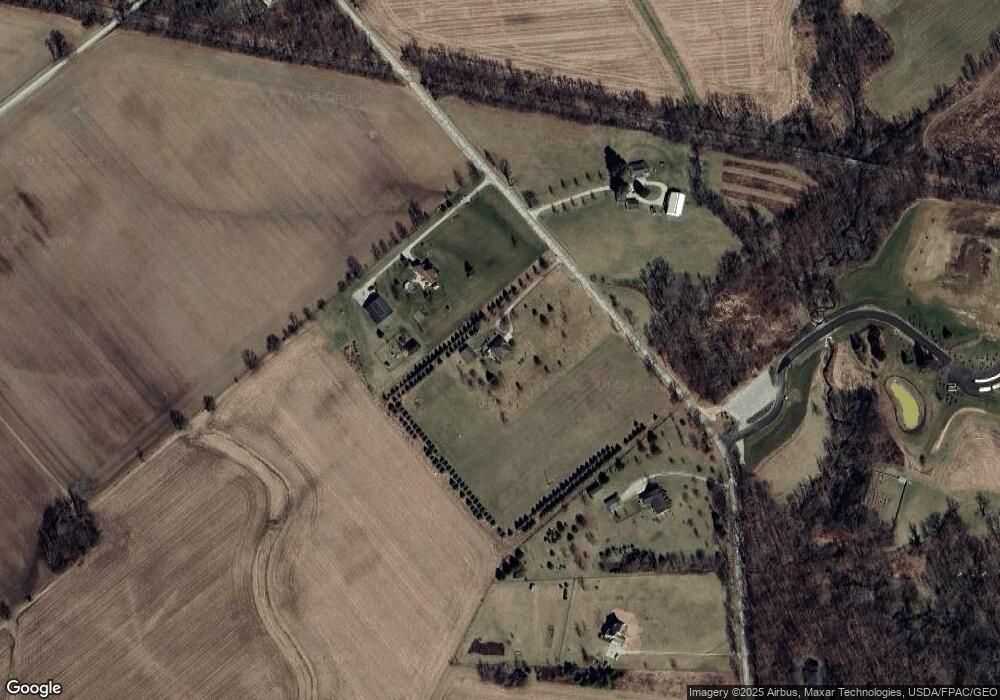
Map
Nearby Homes
- 841 Paintersville New Jasp Rd
- 01 Jasper Rd
- 1293 Gultice Rd
- 0 Jasper Rd Unit 931350
- 3710 N Lakeshore Dr
- 827 Blackfoot Trail
- 4206 N Lakeshore Dr
- 875 Osage Trail
- OA Apache Trail
- 4114 Cherry Grove Rd
- 4070 Beach Trail
- 4.377 ac Cherry Grove Rd
- 902 N Bickett Rd
- 4184 Shawnee Trail
- 4106 Navajo Trail
- 4208 Shawnee Trail
- 4270 Shawnee Trail
- 4065 Apache Trail
- 4288 Alleghany Trail
- 0 Gultice Rd Unit 940427
- 125 S Stringtown Rd
- 219 S Stringtown Rd
- 194 N Springtown Rd
- 281 S Stringtown Rd
- 1995 S Stringtown Rd
- 300 S Stringtown Rd
- 5 S Stringtown Rd
- 425 S Stringtown Rd
- 400 S Stringtown Rd
- 50 N Stringtown Rd
- 565 S Stringtown Rd
- 2700 Jasper Rd
- 2740 Jasper Rd
- 2561 Jasper Rd
- 579 Alexandra Ln
- 582 Alexandra Ln
- 2338 Jasper Rd
- 2425 Jasper Rd
- 608 Alexandra Ln
- 603 Alexandra Ln