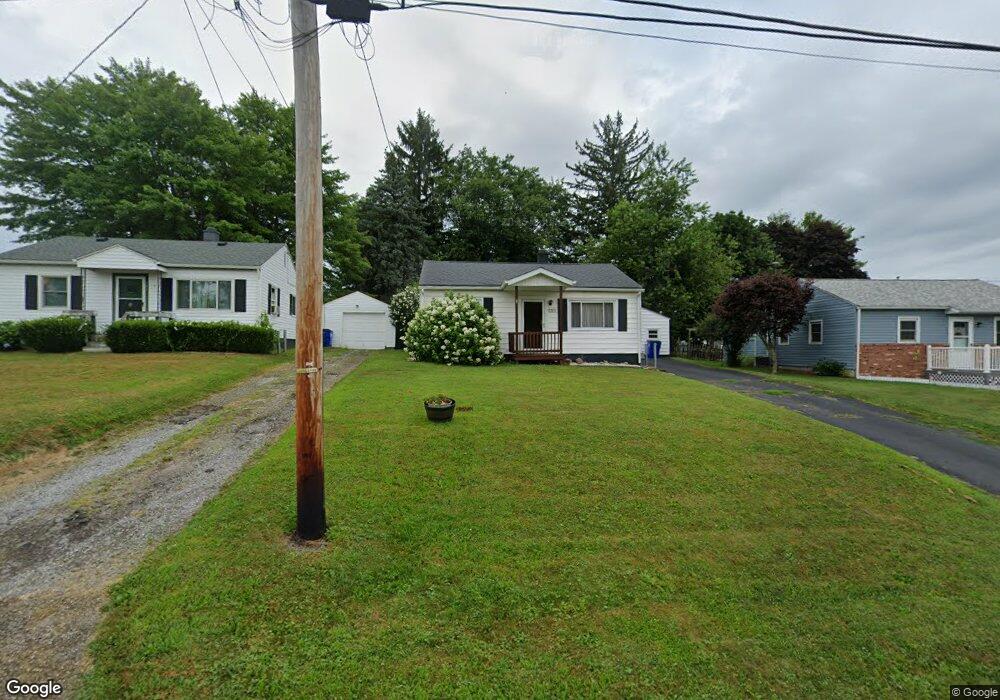
151 S Surry Rd East Liverpool, OH 43920
Estimated Value: $64,000 - $116,000
2
Beds
1
Bath
768
Sq Ft
$107/Sq Ft
Est. Value
About This Home
This home is located at 151 S Surry Rd, East Liverpool, OH 43920 and is currently estimated at $82,531, approximately $107 per square foot. 151 S Surry Rd is a home located in Columbiana County with nearby schools including Westgate Middle School, LaCroft Elementary School, and East Liverpool High School.
Ownership History
Date
Name
Owned For
Owner Type
Purchase Details
Closed on
Aug 24, 2005
Sold by
Lee Letha I
Bought by
Icenhower Patricia Ann and Beaver Karen Sue
Current Estimated Value
Purchase Details
Closed on
Aug 16, 1999
Sold by
Lee Letha I
Bought by
Icenhower Patricia Ann and Beaver Karen Sue
Purchase Details
Closed on
Jul 15, 1998
Sold by
Yeany Susan M
Bought by
Lee Letha I
Purchase Details
Closed on
Aug 7, 1997
Sold by
Pander Earl Wayne
Bought by
Yeany Susan M
Purchase Details
Closed on
May 13, 1997
Sold by
Calhoun Carol A
Bought by
Yeany Earl W Pander and Yeany Susan M
Home Financials for this Owner
Home Financials are based on the most recent Mortgage that was taken out on this home.
Original Mortgage
$40,000
Interest Rate
8.05%
Mortgage Type
New Conventional
Purchase Details
Closed on
Dec 19, 1990
Bought by
Calhoun Carol
Create a Home Valuation Report for This Property
The Home Valuation Report is an in-depth analysis detailing your home's value as well as a comparison with similar homes in the area
Home Values in the Area
Average Home Value in this Area
Purchase History
| Date | Buyer | Sale Price | Title Company |
|---|---|---|---|
| Icenhower Patricia Ann | -- | None Available | |
| Icenhower Patricia Ann | -- | -- | |
| Lee Letha I | $49,000 | -- | |
| Yeany Susan M | -- | -- | |
| Yeany Earl W Pander | $44,500 | -- | |
| Calhoun Carol | $25,000 | -- |
Source: Public Records
Mortgage History
| Date | Status | Borrower | Loan Amount |
|---|---|---|---|
| Previous Owner | Yeany Earl W Pander | $40,000 |
Source: Public Records
Tax History Compared to Growth
Tax History
| Year | Tax Paid | Tax Assessment Tax Assessment Total Assessment is a certain percentage of the fair market value that is determined by local assessors to be the total taxable value of land and additions on the property. | Land | Improvement |
|---|---|---|---|---|
| 2024 | $281 | $16,630 | $2,980 | $13,650 |
| 2023 | $307 | $16,630 | $2,980 | $13,650 |
| 2022 | $324 | $16,630 | $2,980 | $13,650 |
| 2021 | $220 | $13,660 | $2,980 | $10,680 |
| 2020 | $220 | $13,660 | $2,980 | $10,680 |
| 2019 | $220 | $13,660 | $2,980 | $10,680 |
| 2018 | $593 | $12,400 | $2,700 | $9,700 |
| 2017 | $624 | $12,400 | $2,700 | $9,700 |
| 2016 | $622 | $15,230 | $3,750 | $11,480 |
| 2015 | $744 | $15,230 | $3,750 | $11,480 |
| 2014 | $736 | $15,230 | $3,750 | $11,480 |
Source: Public Records
Map
Nearby Homes
- 106 N Surry Rd
- 564 Williams Ave
- 504 Williams Ave
- 118 S Shadylane Dr
- 1912 Lisbon St
- 1874 Idaho Ave
- 0 Kingsridge Rd
- 2249 Lisbon St
- 2512 Boring Ln
- 468 6th Ave
- 139 Huntington Ct
- 138 Huntington Ct
- 140 Huntington Ct
- 539 7th Ave
- 141 Huntington Ct
- 306 Imperial Dr
- 147 Huntington Ct
- 3194 Forest Hills Dr
- 2476 Lisbon St
- 3186 Forest Hills Dr