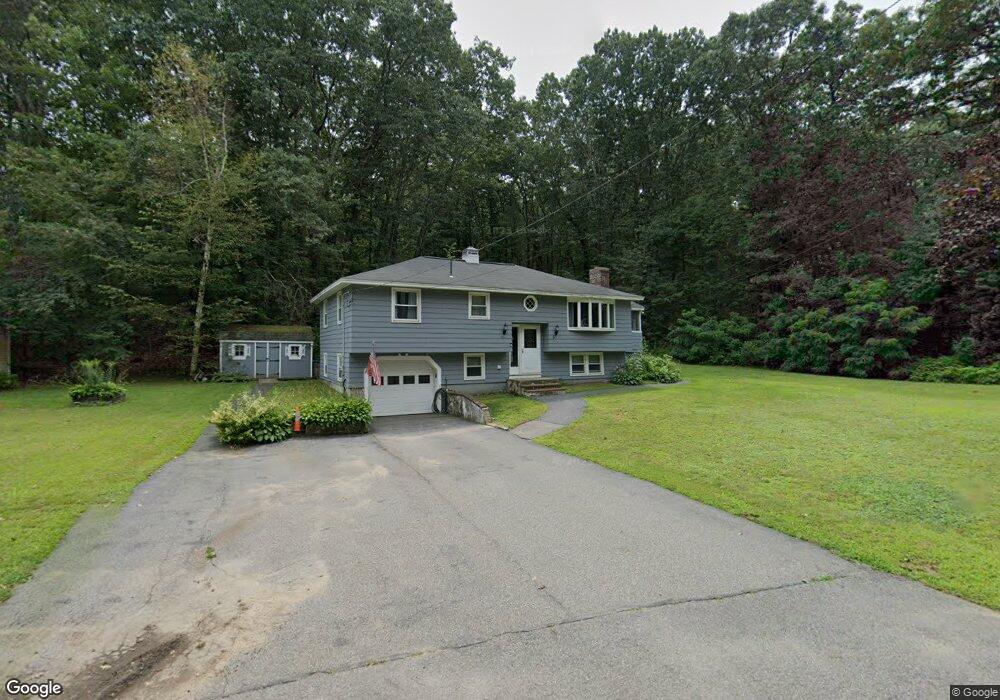
151 Salem Rd Billerica, MA 01821
Estimated Value: $626,000 - $700,000
3
Beds
2
Baths
1,685
Sq Ft
$394/Sq Ft
Est. Value
About This Home
This home is located at 151 Salem Rd, Billerica, MA 01821 and is currently estimated at $664,280, approximately $394 per square foot. 151 Salem Rd is a home located in Middlesex County with nearby schools including Billerica Memorial High School.
Ownership History
Date
Name
Owned For
Owner Type
Purchase Details
Closed on
Apr 15, 2004
Sold by
Vannostrand Helen F and Vannostrand James Joseph
Bought by
Murphy James Joseph and Stratton-Murphy Kelly Jo
Current Estimated Value
Home Financials for this Owner
Home Financials are based on the most recent Mortgage that was taken out on this home.
Original Mortgage
$290,000
Interest Rate
5.58%
Mortgage Type
Purchase Money Mortgage
Purchase Details
Closed on
Mar 26, 2004
Sold by
Vannostrand Helen F
Bought by
Vannostrand Helen F and Murphy James Joseph
Home Financials for this Owner
Home Financials are based on the most recent Mortgage that was taken out on this home.
Original Mortgage
$290,000
Interest Rate
5.58%
Mortgage Type
Purchase Money Mortgage
Purchase Details
Closed on
Apr 1, 1996
Sold by
Noble Patricia and Noble Paul H
Bought by
Vannostrand Robert and Vannostrand Helen
Purchase Details
Closed on
Apr 24, 1989
Sold by
Goldberg Deborah
Bought by
Noble Paul
Create a Home Valuation Report for This Property
The Home Valuation Report is an in-depth analysis detailing your home's value as well as a comparison with similar homes in the area
Home Values in the Area
Average Home Value in this Area
Purchase History
| Date | Buyer | Sale Price | Title Company |
|---|---|---|---|
| Murphy James Joseph | -- | -- | |
| Vannostrand Helen F | -- | -- | |
| Vannostrand Robert | $155,500 | -- | |
| Noble Paul | $165,000 | -- |
Source: Public Records
Mortgage History
| Date | Status | Borrower | Loan Amount |
|---|---|---|---|
| Open | Noble Paul | $348,750 | |
| Closed | Murphy James Joseph | $290,000 | |
| Previous Owner | Noble Paul | $168,127 |
Source: Public Records
Tax History Compared to Growth
Tax History
| Year | Tax Paid | Tax Assessment Tax Assessment Total Assessment is a certain percentage of the fair market value that is determined by local assessors to be the total taxable value of land and additions on the property. | Land | Improvement |
|---|---|---|---|---|
| 2025 | $6,543 | $575,500 | $320,200 | $255,300 |
| 2024 | $5,792 | $513,000 | $289,200 | $223,800 |
| 2023 | $5,547 | $467,300 | $252,300 | $215,000 |
| 2022 | $5,161 | $408,300 | $221,200 | $187,100 |
| 2021 | $4,979 | $383,000 | $201,800 | $181,200 |
| 2020 | $4,875 | $375,300 | $194,100 | $181,200 |
| 2019 | $4,745 | $352,000 | $182,400 | $169,600 |
| 2018 | $4,596 | $323,900 | $165,000 | $158,900 |
| 2017 | $4,278 | $303,600 | $159,100 | $144,500 |
| 2016 | $4,222 | $298,600 | $154,100 | $144,500 |
| 2015 | $4,073 | $290,100 | $145,600 | $144,500 |
| 2014 | $4,177 | $292,300 | $144,000 | $148,300 |
Source: Public Records
Map
Nearby Homes