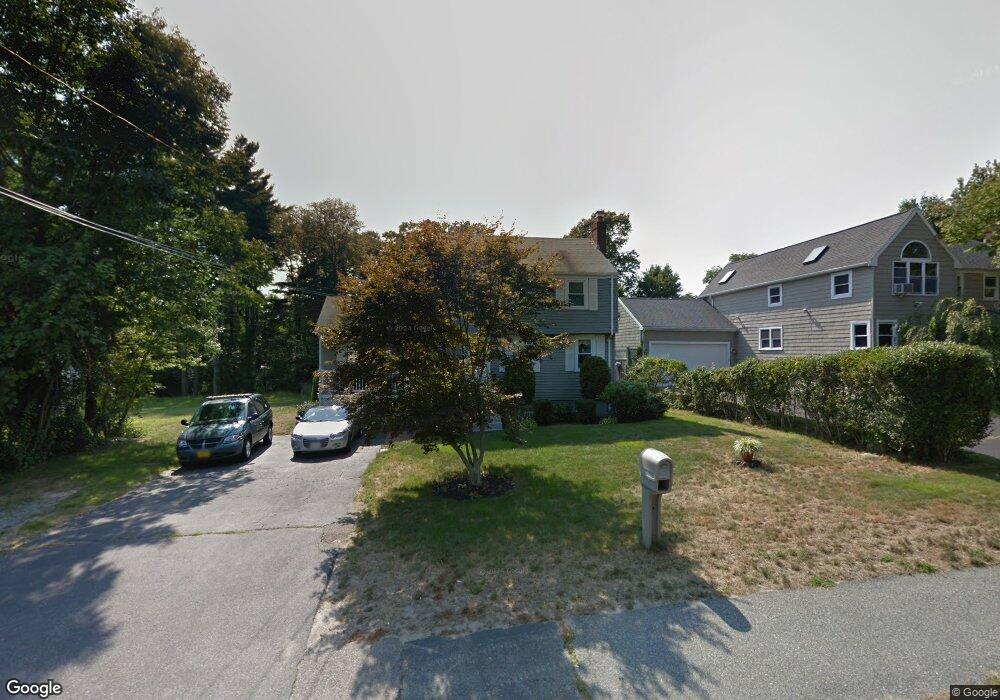
151 Sycamore St Holbrook, MA 02343
Estimated Value: $549,891 - $653,000
3
Beds
2
Baths
1,272
Sq Ft
$467/Sq Ft
Est. Value
About This Home
This home is located at 151 Sycamore St, Holbrook, MA 02343 and is currently estimated at $593,973, approximately $466 per square foot. 151 Sycamore St is a home located in Norfolk County with nearby schools including John F. Kennedy Elementary School, Holbrook Middle High School, and Boston Higashi School.
Ownership History
Date
Name
Owned For
Owner Type
Purchase Details
Closed on
Dec 28, 2020
Sold by
Jones Kathleen B
Bought by
Jones Randall P and Jones Kathleen B
Current Estimated Value
Purchase Details
Closed on
Aug 12, 2004
Sold by
Robert A Fitzgerald Lt and Fitzgerald
Bought by
Jones Kathleen B
Create a Home Valuation Report for This Property
The Home Valuation Report is an in-depth analysis detailing your home's value as well as a comparison with similar homes in the area
Home Values in the Area
Average Home Value in this Area
Purchase History
| Date | Buyer | Sale Price | Title Company |
|---|---|---|---|
| Jones Randall P | -- | None Available | |
| Jones Randall P | -- | None Available | |
| Jones Randall P | -- | None Available | |
| Jones Kathleen B | -- | -- | |
| Jones Kathleen B | -- | -- | |
| Jones Kathleen B | -- | -- |
Source: Public Records
Mortgage History
| Date | Status | Borrower | Loan Amount |
|---|---|---|---|
| Previous Owner | Jones Kathleen B | $100,000 |
Source: Public Records
Tax History
| Year | Tax Paid | Tax Assessment Tax Assessment Total Assessment is a certain percentage of the fair market value that is determined by local assessors to be the total taxable value of land and additions on the property. | Land | Improvement |
|---|---|---|---|---|
| 2025 | $67 | $509,300 | $282,500 | $226,800 |
| 2024 | $6,276 | $467,000 | $244,000 | $223,000 |
| 2023 | $6,595 | $428,800 | $233,500 | $195,300 |
| 2022 | $6,133 | $371,900 | $199,000 | $172,900 |
| 2021 | $6,067 | $352,300 | $186,000 | $166,300 |
| 2020 | $6,132 | $333,800 | $171,500 | $162,300 |
| 2019 | $6,190 | $318,100 | $163,400 | $154,700 |
| 2018 | $5,876 | $284,300 | $133,600 | $150,700 |
| 2017 | $5,576 | $266,800 | $121,400 | $145,400 |
| 2016 | $5,120 | $260,700 | $119,200 | $141,500 |
| 2015 | $4,656 | $244,000 | $110,400 | $133,600 |
| 2014 | $4,480 | $238,700 | $110,400 | $128,300 |
Source: Public Records
Map
Nearby Homes
- 45 Ernest St
- 360 Plymouth St
- 88 Roseen Rd
- 184 Belcher St
- 181 S Franklin St Unit 102
- 181 S Franklin St Unit 206
- 123-125 N Franklin St
- 152 S Franklin St
- 95 Rindone St
- 58 Chandler St
- 375 S Franklin St Unit 1
- 27 Winter St
- 24 Reeds Ln
- 44 Old Forge Rd
- 278 N Franklin St
- 14 Jamieson St
- 129 Albee Dr
- 1696 Liberty St
- 8 Dianthus Rd
- 39 Canavan Dr
- 147 Sycamore St
- 155 Sycamore St
- 94 Stevens Dr
- 143 Sycamore St
- 186 Sycamore St
- 159 Sycamore St
- 90 Stevens Dr
- 139 Sycamore St
- 163 Sycamore St
- 67 Stevens Dr
- 4 Gioioso Dr
- 192 Sycamore St
- 126 Sycamore St
- 8 Gioioso Dr
- 86 Stevens Dr
- 13 Gioioso Dr
- 131 Sycamore St
- 63 Stevens Dr
- 167 Sycamore St
- 120 Sycamore St
Your Personal Tour Guide
Ask me questions while you tour the home.