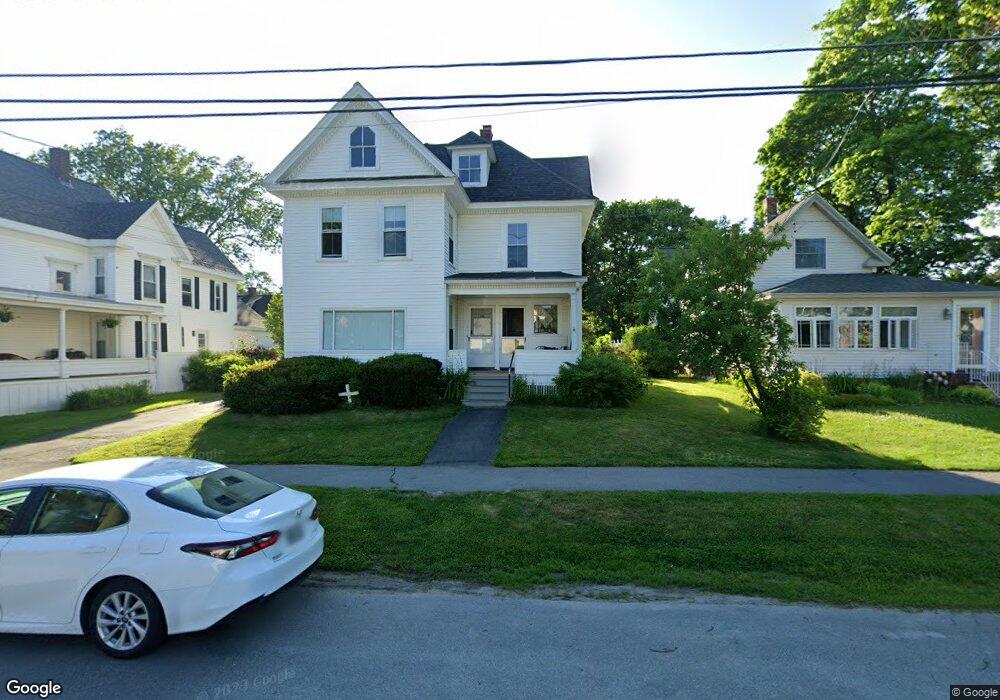
151 W Broadway Bangor, ME 04401
West Bangor NeighborhoodEstimated Value: $304,000 - $359,452
4
Beds
2
Baths
2,438
Sq Ft
$137/Sq Ft
Est. Value
About This Home
This home is located at 151 W Broadway, Bangor, ME 04401 and is currently estimated at $334,113, approximately $137 per square foot. 151 W Broadway is a home with nearby schools including Vine Street School, Fairmount School, and James F. Doughty School.
Ownership History
Date
Name
Owned For
Owner Type
Purchase Details
Closed on
Aug 14, 2025
Sold by
Scharer Philip R and Scharer Tamera A
Bought by
Tamera and Tamera Philip Scharer
Current Estimated Value
Purchase Details
Closed on
Jun 5, 2023
Sold by
Mcintyre Real Estate Llc
Bought by
Scharer Philip R and Scharer Tamera A
Home Financials for this Owner
Home Financials are based on the most recent Mortgage that was taken out on this home.
Original Mortgage
$318,131
Interest Rate
6.39%
Mortgage Type
FHA
Create a Home Valuation Report for This Property
The Home Valuation Report is an in-depth analysis detailing your home's value as well as a comparison with similar homes in the area
Home Values in the Area
Average Home Value in this Area
Purchase History
| Date | Buyer | Sale Price | Title Company |
|---|---|---|---|
| Tamera | -- | -- | |
| Scharer Philip R | -- | None Available |
Source: Public Records
Mortgage History
| Date | Status | Borrower | Loan Amount |
|---|---|---|---|
| Previous Owner | Scharer Philip R | $318,131 |
Source: Public Records
Tax History
| Year | Tax Paid | Tax Assessment Tax Assessment Total Assessment is a certain percentage of the fair market value that is determined by local assessors to be the total taxable value of land and additions on the property. | Land | Improvement |
|---|---|---|---|---|
| 2024 | $5,162 | $278,300 | $25,800 | $252,500 |
| 2023 | $4,855 | $253,500 | $25,800 | $227,700 |
| 2022 | $4,380 | $214,700 | $25,800 | $188,900 |
| 2021 | $4,241 | $190,200 | $23,900 | $166,300 |
| 2020 | $3,707 | $159,800 | $23,300 | $136,500 |
| 2019 | $3,537 | $153,800 | $23,300 | $130,500 |
| 2018 | $3,305 | $144,000 | $23,300 | $120,700 |
| 2017 | $3,211 | $142,400 | $23,300 | $119,100 |
| 2016 | $3,137 | $139,400 | $23,300 | $116,100 |
| 2015 | $3,060 | $139,400 | $23,300 | $116,100 |
| 2014 | $2,998 | $137,500 | $23,300 | $114,200 |
| 2013 | $2,860 | $137,500 | $23,300 | $114,200 |
Source: Public Records
Map
Nearby Homes
Your Personal Tour Guide
Ask me questions while you tour the home.