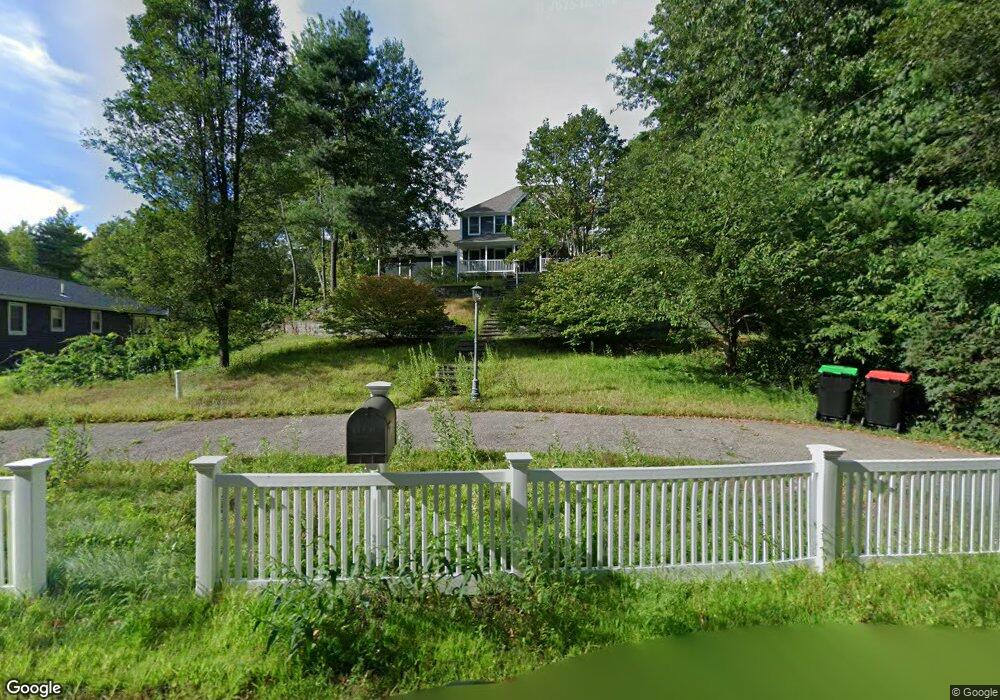
151 Wampum St Plainville, MA 02762
Estimated Value: $753,000 - $849,000
4
Beds
3
Baths
2,450
Sq Ft
$326/Sq Ft
Est. Value
About This Home
This home is located at 151 Wampum St, Plainville, MA 02762 and is currently estimated at $799,180, approximately $326 per square foot. 151 Wampum St is a home located in Norfolk County with nearby schools including Anna Ware Jackson School and Beatrice H. Wood Elementary School.
Ownership History
Date
Name
Owned For
Owner Type
Purchase Details
Closed on
Sep 10, 2018
Sold by
Fisher Jason R and Fisher Kathleen
Bought by
Fisher Kathleen
Current Estimated Value
Home Financials for this Owner
Home Financials are based on the most recent Mortgage that was taken out on this home.
Original Mortgage
$245,000
Interest Rate
3.1%
Mortgage Type
New Conventional
Create a Home Valuation Report for This Property
The Home Valuation Report is an in-depth analysis detailing your home's value as well as a comparison with similar homes in the area
Home Values in the Area
Average Home Value in this Area
Purchase History
| Date | Buyer | Sale Price | Title Company |
|---|---|---|---|
| Fisher Kathleen | -- | None Available | |
| Fisher Kathleen | -- | None Available |
Source: Public Records
Mortgage History
| Date | Status | Borrower | Loan Amount |
|---|---|---|---|
| Previous Owner | Fisher Kathleen | $245,000 |
Source: Public Records
Tax History Compared to Growth
Tax History
| Year | Tax Paid | Tax Assessment Tax Assessment Total Assessment is a certain percentage of the fair market value that is determined by local assessors to be the total taxable value of land and additions on the property. | Land | Improvement |
|---|---|---|---|---|
| 2025 | $83 | $716,500 | $241,500 | $475,000 |
| 2024 | $7,799 | $649,900 | $220,000 | $429,900 |
| 2023 | $7,613 | $610,000 | $220,000 | $390,000 |
| 2022 | $7,297 | $520,100 | $211,100 | $309,000 |
| 2021 | $7,109 | $483,600 | $211,100 | $272,500 |
| 2020 | $6,930 | $471,400 | $211,100 | $260,300 |
| 2019 | $7,091 | $473,700 | $201,500 | $272,200 |
| 2018 | $6,989 | $464,100 | $191,900 | $272,200 |
| 2017 | $6,860 | $457,300 | $200,700 | $256,600 |
| 2016 | $6,587 | $444,200 | $200,700 | $243,500 |
| 2015 | $6,550 | $424,800 | $165,600 | $259,200 |
| 2014 | $6,400 | $427,800 | $165,600 | $262,200 |
Source: Public Records
Map
Nearby Homes
- 1204 South St
- 1222 South St
- 4 Munroe Dr
- 791 South St Unit 5
- 160 Washington St Unit 36
- 12 Grant St
- 387 South St
- 158 Washington St
- 126 Washington St
- 130 Washington St
- 124 Washington St
- 44 Maple Terrace Unit 44
- 80 Willow Ln
- 19 Chestnut Lot 0
- 319 Taunton St
- 29 Broad St
- 9 Oak Dr
- 50 Green St
- Lot 1 - Blueberry 2 Car Plan at King Philip Estates
- Lot 8 - Blueberry 2 Car Plan at King Philip Estates