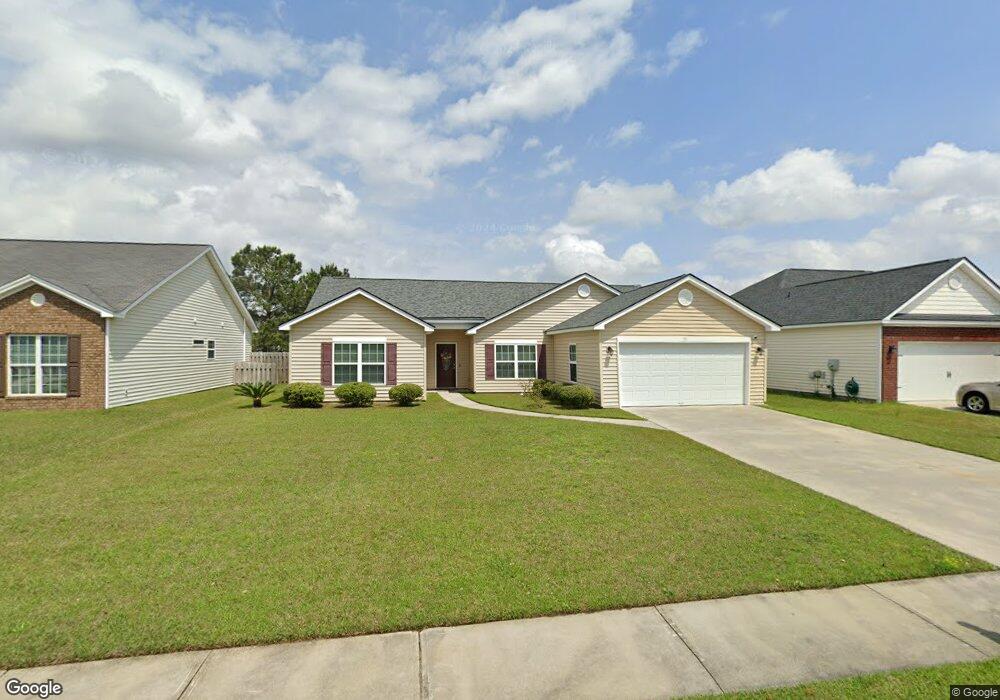
151 Willow Point Cir Pooler, GA 31322
Godley Station NeighborhoodEstimated Value: $347,201 - $368,000
4
Beds
2
Baths
2,016
Sq Ft
$177/Sq Ft
Est. Value
About This Home
This home is located at 151 Willow Point Cir, Pooler, GA 31322 and is currently estimated at $356,300, approximately $176 per square foot. 151 Willow Point Cir is a home located in Chatham County with nearby schools including Godley Station School, Groves High School, and Savannah Adventist Christian School.
Ownership History
Date
Name
Owned For
Owner Type
Purchase Details
Closed on
Oct 12, 2023
Sold by
Scott Marie B
Bought by
Scott Family Preservation Trust and Woodson Priscilla
Current Estimated Value
Purchase Details
Closed on
Jan 20, 2022
Sold by
Johnson Sherran C
Bought by
Scott Marie B
Home Financials for this Owner
Home Financials are based on the most recent Mortgage that was taken out on this home.
Original Mortgage
$142,500
Interest Rate
2.62%
Mortgage Type
Cash
Purchase Details
Closed on
Nov 5, 2009
Sold by
Srh Investments Llc
Bought by
Johnson Sherran C
Home Financials for this Owner
Home Financials are based on the most recent Mortgage that was taken out on this home.
Original Mortgage
$160,150
Interest Rate
4.92%
Mortgage Type
New Conventional
Purchase Details
Closed on
May 11, 2009
Sold by
Genesis Designer Homes Llc
Bought by
Srh Investments Llc
Purchase Details
Closed on
Nov 15, 2005
Sold by
Not Provided
Bought by
Johnson Sherran C
Create a Home Valuation Report for This Property
The Home Valuation Report is an in-depth analysis detailing your home's value as well as a comparison with similar homes in the area
Home Values in the Area
Average Home Value in this Area
Purchase History
| Date | Buyer | Sale Price | Title Company |
|---|---|---|---|
| Scott Family Preservation Trust | -- | -- | |
| Scott Marie B | $285,000 | -- | |
| Johnson Sherran C | $160,150 | -- | |
| Srh Investments Llc | $25,000 | -- | |
| Johnson Sherran C | $1,320,000 | -- |
Source: Public Records
Mortgage History
| Date | Status | Borrower | Loan Amount |
|---|---|---|---|
| Previous Owner | Scott Marie B | $142,500 | |
| Previous Owner | Johnson Sherran C | $160,150 |
Source: Public Records
Tax History
| Year | Tax Paid | Tax Assessment Tax Assessment Total Assessment is a certain percentage of the fair market value that is determined by local assessors to be the total taxable value of land and additions on the property. | Land | Improvement |
|---|---|---|---|---|
| 2025 | $2,640 | $139,240 | $28,000 | $111,240 |
| 2024 | $20 | $121,480 | $26,000 | $95,480 |
| 2023 | $921 | $112,160 | $18,000 | $94,160 |
| 2022 | $2,295 | $93,520 | $12,800 | $80,720 |
| 2021 | $3,338 | $84,320 | $12,800 | $71,520 |
| 2020 | $2,357 | $84,320 | $12,800 | $71,520 |
| 2019 | $3,441 | $84,320 | $12,800 | $71,520 |
| 2018 | $3,396 | $81,520 | $12,800 | $68,720 |
| 2017 | $2,922 | $78,080 | $12,800 | $65,280 |
| 2016 | $1,947 | $73,040 | $10,000 | $63,040 |
| 2015 | $2,725 | $69,760 | $10,000 | $59,760 |
| 2014 | $3,718 | $70,680 | $0 | $0 |
Source: Public Records
Map
Nearby Homes
- 149 Willow Point Cir
- 158 Willow Point Cir
- 142 Willow Point Cir
- 163 Willow Point Cir
- 100 Cumberland Way
- 190 Willow Point Cir
- 218 Willow Point Ln
- 171 Greyfield Cir
- 106 Wind Willow Dr
- 123 Wind Willow Dr
- 153 Greyfield Cir
- 44 Winter Lake Cir
- 45 Telford St
- 128 Winslow Cir
- 54 Brookhaven Dr
- 36 Redwall Cir
- 225 Willow Point Cir
- 194 Brickhill Cir
- 138 Troupe Dr
- 282 Willow Point Cir
- 151 Willow Point Cir
- 153 Willow Point Cir
- 149 Willow Point Cir
- 155 Willow Point Cir
- 155 Willow Point Cir
- 147 Willow Point Cir
- 32 Bay Willow Ct
- 32 Bay Willow Ct
- 30 Bay Willow Ct
- 154 Willow Point Cir
- 152 Willow Point Cir
- 154 Willow Point Cir
- 34 Bay Willow Ct
- 150 Willow Point Cir
- 150 Willow Point Cir
- 157 Willow Point Cir
- 156 Willow Point Cir Unit 27
- 156 Willow Point Cir
- 28 Bay Willow Ct
- 28 Bay Willow Ct
Your Personal Tour Guide
Ask me questions while you tour the home.