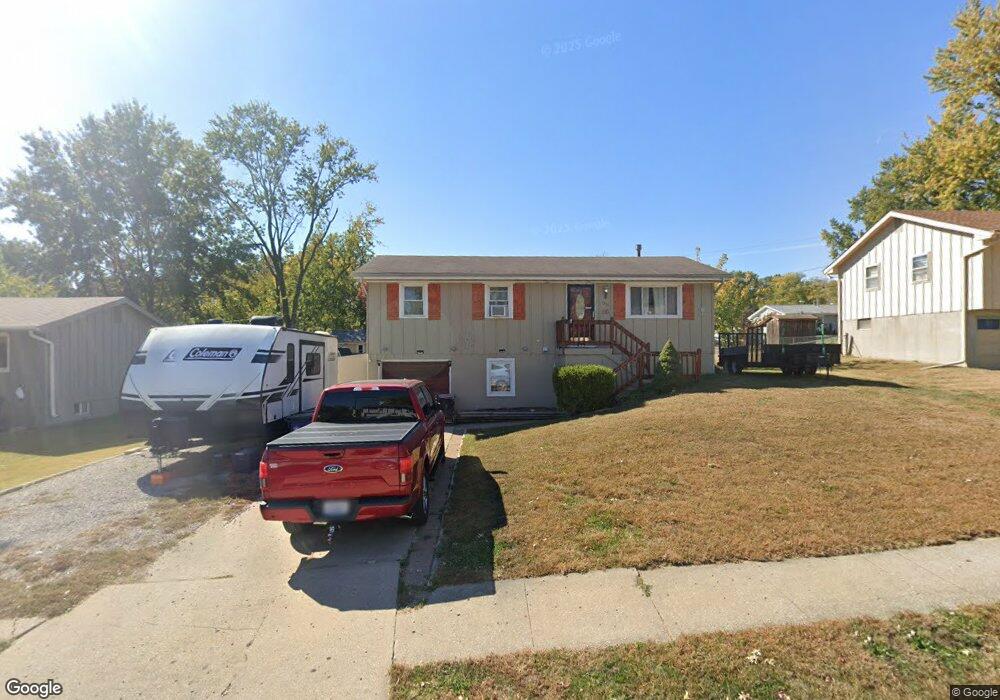
1510 Mcclellan Dr Liberty, MO 64068
Estimated Value: $205,000 - $247,000
3
Beds
2
Baths
880
Sq Ft
$260/Sq Ft
Est. Value
About This Home
This home is located at 1510 Mcclellan Dr, Liberty, MO 64068 and is currently estimated at $229,190, approximately $260 per square foot. 1510 Mcclellan Dr is a home located in Clay County with nearby schools including Manor Hill Elementary School, Liberty Middle School, and Liberty High School.
Ownership History
Date
Name
Owned For
Owner Type
Purchase Details
Closed on
Oct 22, 2018
Sold by
Oldag Chad L and Oldag Holly J
Bought by
Mcclung Alan D and Mcclung Jennifer K
Current Estimated Value
Home Financials for this Owner
Home Financials are based on the most recent Mortgage that was taken out on this home.
Original Mortgage
$99,500
Outstanding Balance
$86,770
Interest Rate
4.5%
Mortgage Type
New Conventional
Estimated Equity
$142,420
Purchase Details
Closed on
Mar 16, 2000
Sold by
Abbs Carl E and Abbs Lajoy F
Bought by
Oldag Holly J and Oldag Chad L
Home Financials for this Owner
Home Financials are based on the most recent Mortgage that was taken out on this home.
Original Mortgage
$87,974
Interest Rate
8.23%
Mortgage Type
FHA
Purchase Details
Closed on
Dec 29, 1999
Sold by
Harder Thomas W and Harder Joan M
Bought by
Abbs Carl E and Abbs Lajoy F
Create a Home Valuation Report for This Property
The Home Valuation Report is an in-depth analysis detailing your home's value as well as a comparison with similar homes in the area
Home Values in the Area
Average Home Value in this Area
Purchase History
| Date | Buyer | Sale Price | Title Company |
|---|---|---|---|
| Mcclung Alan D | -- | Thomson Affinity Title Llc | |
| Oldag Holly J | -- | United Title Company | |
| Abbs Carl E | -- | United Title Company |
Source: Public Records
Mortgage History
| Date | Status | Borrower | Loan Amount |
|---|---|---|---|
| Open | Mcclung Alan D | $99,500 | |
| Previous Owner | Oldag Holly J | $87,974 |
Source: Public Records
Tax History
| Year | Tax Paid | Tax Assessment Tax Assessment Total Assessment is a certain percentage of the fair market value that is determined by local assessors to be the total taxable value of land and additions on the property. | Land | Improvement |
|---|---|---|---|---|
| 2025 | $1,885 | $28,160 | -- | -- |
| 2024 | $1,885 | $24,510 | -- | -- |
| 2023 | $1,917 | $24,510 | $0 | $0 |
| 2022 | $1,767 | $22,310 | $0 | $0 |
| 2021 | $1,754 | $22,306 | $5,320 | $16,986 |
| 2020 | $1,806 | $21,570 | $0 | $0 |
| 2019 | $1,805 | $21,565 | $5,320 | $16,245 |
Source: Public Records
Map
Nearby Homes
- 1705 Johnston St
- 409 Lilly Ln
- 457 Lilly Ln
- 507 Vivian St
- 1108 S Prairie St
- 516 Sharon Dr
- 915 S Prairie St
- 813 S Main St
- 964 Wellington Way
- 1516 Glen Brook Ln
- 1505 Ashton Dr
- 653 Butternut Ct
- 5 E Brown St
- 408 W Murray Rd
- 1515 Trumpet Ct
- 1172 White Oak Ln
- 339 S Missouri St
- 2600 Magnolia Ave
- 1829 White Tail Ln
- 823 Reed St
- 1508 Mcclellan Dr
- 1512 Mcclellan Dr
- 1513 S Skyline Dr
- 1511 S Skyline Dr
- 1506 Mcclellan Dr
- 1601 S Skyline Dr
- 1514 Mcclellan Dr
- 1513 Mcclellan Dr
- 1511 Mcclellan Dr
- 1509 S Skyline Dr
- 1515 Mcclellan Dr
- 1504 Mcclellan Dr
- 1509 Mcclellan Dr
- 1507 S Skyline Dr
- 1605 S Skyline Dr
- 1507 Mcclellan Dr
- 1502 Mcclellan Dr
- 1512 S Skyline Dr
- 184 Lee Dr
- 1600 S Skyline Dr
Your Personal Tour Guide
Ask me questions while you tour the home.