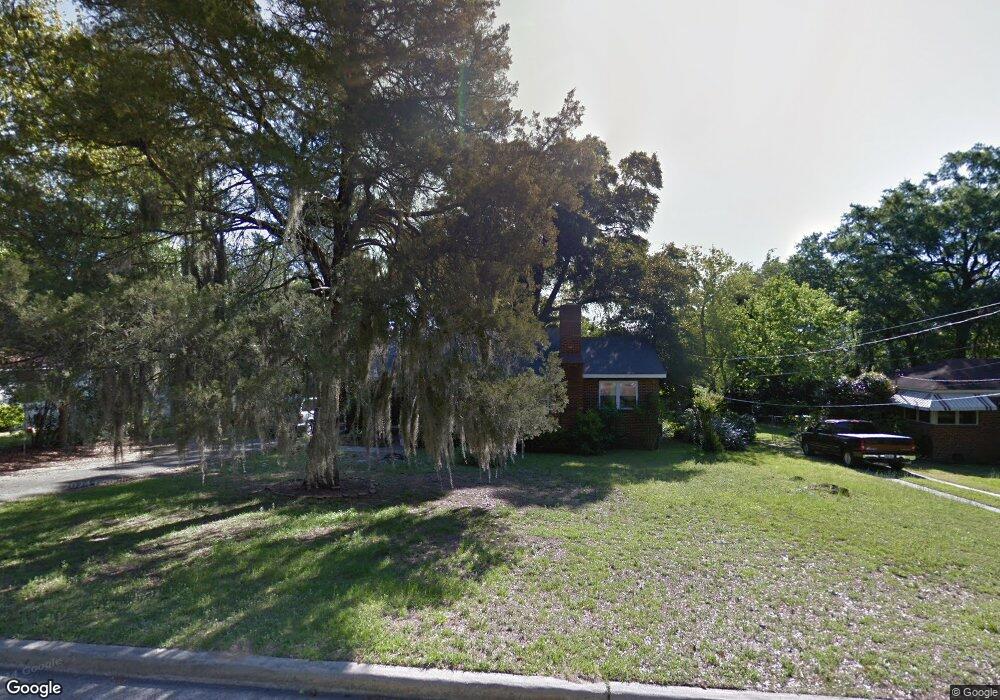
1510 Myrtle Ln Augusta, GA 30904
Pendleton King NeighborhoodEstimated Value: $126,000 - $184,000
3
Beds
1
Bath
1,281
Sq Ft
$118/Sq Ft
Est. Value
About This Home
This home is located at 1510 Myrtle Ln, Augusta, GA 30904 and is currently estimated at $151,257, approximately $118 per square foot. 1510 Myrtle Ln is a home located in Richmond County with nearby schools including Monte Sano Elementary School, Johnson Magnet, and Langford Middle School.
Ownership History
Date
Name
Owned For
Owner Type
Purchase Details
Closed on
Apr 6, 2021
Sold by
Elsey Gwendolyn J
Bought by
Conner Douglas
Current Estimated Value
Purchase Details
Closed on
Feb 6, 2006
Sold by
Harris John K
Bought by
Elsey Gwendolyn J
Home Financials for this Owner
Home Financials are based on the most recent Mortgage that was taken out on this home.
Original Mortgage
$86,330
Interest Rate
6.14%
Mortgage Type
Fannie Mae Freddie Mac
Purchase Details
Closed on
Feb 18, 1998
Sold by
Haastrecht John P Van
Bought by
Harris John K
Home Financials for this Owner
Home Financials are based on the most recent Mortgage that was taken out on this home.
Original Mortgage
$67,830
Interest Rate
6.89%
Mortgage Type
VA
Purchase Details
Closed on
May 29, 1992
Sold by
Mccall Mark D
Bought by
Vanhaastrecht John
Purchase Details
Closed on
Sep 1, 1986
Sold by
Whaley Henry Melvin
Bought by
Mccall Mark D
Create a Home Valuation Report for This Property
The Home Valuation Report is an in-depth analysis detailing your home's value as well as a comparison with similar homes in the area
Home Values in the Area
Average Home Value in this Area
Purchase History
| Date | Buyer | Sale Price | Title Company |
|---|---|---|---|
| Conner Douglas | $100,000 | -- | |
| Elsey Gwendolyn J | $89,000 | None Available | |
| Harris John K | $66,500 | -- | |
| Vanhaastrecht John | $53,000 | -- | |
| Mccall Mark D | $43,000 | -- |
Source: Public Records
Mortgage History
| Date | Status | Borrower | Loan Amount |
|---|---|---|---|
| Previous Owner | Elsey Gwendolyn J | $86,330 | |
| Previous Owner | Harris John K | $67,830 |
Source: Public Records
Tax History Compared to Growth
Tax History
| Year | Tax Paid | Tax Assessment Tax Assessment Total Assessment is a certain percentage of the fair market value that is determined by local assessors to be the total taxable value of land and additions on the property. | Land | Improvement |
|---|---|---|---|---|
| 2025 | $1,942 | $58,868 | $5,200 | $53,668 |
| 2024 | $1,942 | $51,604 | $5,200 | $46,404 |
| 2023 | $1,665 | $55,664 | $5,200 | $50,464 |
| 2022 | $1,433 | $36,706 | $5,200 | $31,506 |
| 2021 | $1,141 | $29,722 | $5,200 | $24,522 |
| 2020 | $1,301 | $34,974 | $8,000 | $26,974 |
| 2019 | $1,372 | $34,974 | $8,000 | $26,974 |
| 2018 | $1,381 | $34,974 | $8,000 | $26,974 |
| 2017 | $1,375 | $34,974 | $8,000 | $26,974 |
| 2016 | $1,376 | $34,974 | $8,000 | $26,974 |
| 2015 | $1,384 | $34,974 | $8,000 | $26,974 |
| 2014 | $1,385 | $34,974 | $8,000 | $26,974 |
Source: Public Records
Map
Nearby Homes
- 1447 Heard Ave
- 1703 Holly Hill Rd
- 1437 Troupe St
- 2001 Hiram Rd
- 1435 Troupe St
- 1433 Troupe St
- 1430 Heard Ave
- 1613 Kissingbower Rd
- 1611 Pendleton Rd
- 1608 Winter St
- 1621 Pendleton Rd
- 1327 Hickman Rd
- 2232 Lee St
- 1729 Oak Dr
- 1736 Kissingbower Rd
- 1224 Meigs St
- 2014 Richmond Ave
- 2038 Wharton Dr
- 1741 Kissingbower Rd
- 1508 Myrtle Ln
- 1512 Myrtle Ln
- 1511 Myrtle Ln
- 1509 Myrtle Ln
- 1507 Myrtle Ln
- 1504 Myrtle Ln
- 1505 Myrtle Ln
- 1502 Myrtle Ln
- 2116 Cresswell Dr
- 2118 Cresswell Dr
- 1503 Myrtle Ln
- 2120 Cresswell Dr
- 2122 Cresswell Dr
- 2113 Cresswell Dr Unit A
- 2113 Cresswell Dr
- 2115 Cresswell Dr
- 2117 Cresswell Dr
- 2119 Cresswell Dr
- 2130 Cresswell Dr
- 2121 Cresswell Dr