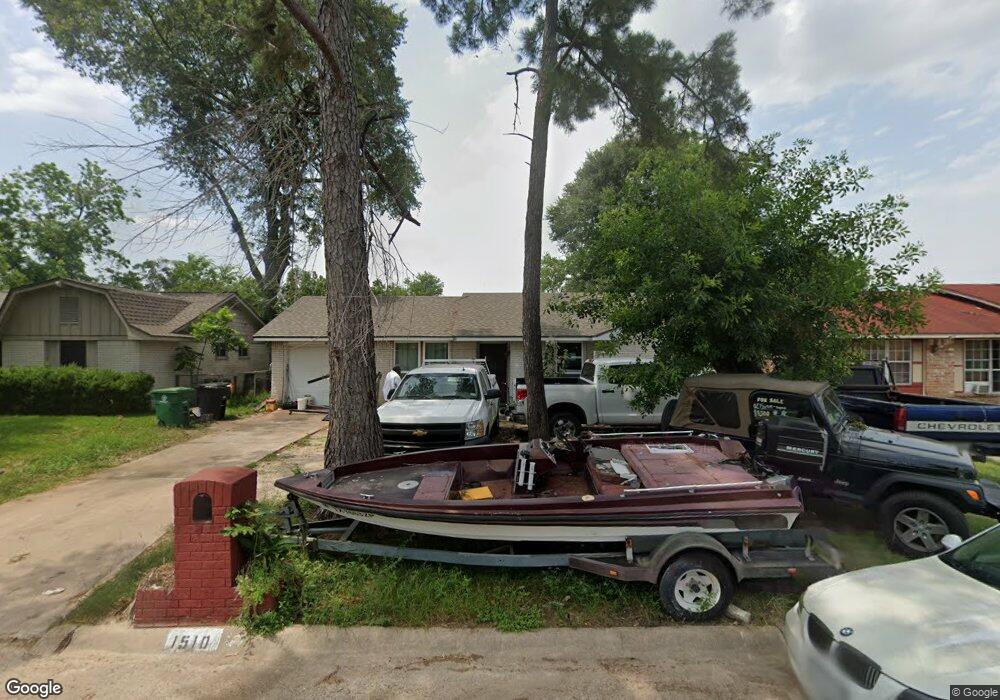
1510 Saddle Rock Dr Houston, TX 77088
Acres Homes NeighborhoodEstimated Value: $178,517 - $202,000
3
Beds
2
Baths
938
Sq Ft
$203/Sq Ft
Est. Value
About This Home
This home is located at 1510 Saddle Rock Dr, Houston, TX 77088 and is currently estimated at $190,879, approximately $203 per square foot. 1510 Saddle Rock Dr is a home located in Harris County with nearby schools including Hill Intermediate School, Stovall School, and Dr. Viola K. Garcia Middle School.
Ownership History
Date
Name
Owned For
Owner Type
Purchase Details
Closed on
Dec 18, 2018
Sold by
Merry Homes Inc
Bought by
Saldana Victor
Current Estimated Value
Home Financials for this Owner
Home Financials are based on the most recent Mortgage that was taken out on this home.
Original Mortgage
$84,621
Outstanding Balance
$74,558
Interest Rate
4.9%
Mortgage Type
Purchase Money Mortgage
Estimated Equity
$116,321
Purchase Details
Closed on
Aug 4, 2009
Sold by
Mendez Luis D and Mendez Paula J
Bought by
Merry Homes Inc
Purchase Details
Closed on
Feb 17, 2007
Sold by
Merry Homes Inc
Bought by
Mendez Luis D and Mendez Paula J
Home Financials for this Owner
Home Financials are based on the most recent Mortgage that was taken out on this home.
Original Mortgage
$85,000
Interest Rate
6.08%
Mortgage Type
Seller Take Back
Purchase Details
Closed on
Jan 14, 1993
Sold by
Liao Howard
Bought by
Merry Homes Inc
Create a Home Valuation Report for This Property
The Home Valuation Report is an in-depth analysis detailing your home's value as well as a comparison with similar homes in the area
Home Values in the Area
Average Home Value in this Area
Purchase History
| Date | Buyer | Sale Price | Title Company |
|---|---|---|---|
| Saldana Victor | -- | None Available | |
| Merry Homes Inc | $70,000 | None Available | |
| Mendez Luis D | -- | None Available | |
| Merry Homes Inc | -- | -- |
Source: Public Records
Mortgage History
| Date | Status | Borrower | Loan Amount |
|---|---|---|---|
| Open | Saldana Victor | $84,621 | |
| Previous Owner | Mendez Luis D | $85,000 |
Source: Public Records
Tax History Compared to Growth
Tax History
| Year | Tax Paid | Tax Assessment Tax Assessment Total Assessment is a certain percentage of the fair market value that is determined by local assessors to be the total taxable value of land and additions on the property. | Land | Improvement |
|---|---|---|---|---|
| 2025 | $2,033 | $169,775 | $56,023 | $113,752 |
| 2024 | $2,033 | $155,337 | $36,104 | $119,233 |
| 2023 | $2,033 | $155,337 | $36,104 | $119,233 |
| 2022 | $2,988 | $142,327 | $31,124 | $111,203 |
| 2021 | $2,844 | $127,832 | $31,124 | $96,708 |
| 2020 | $2,717 | $111,994 | $31,124 | $80,870 |
| 2019 | $2,590 | $93,580 | $11,205 | $82,375 |
| 2018 | $790 | $80,000 | $11,205 | $68,795 |
| 2017 | $2,122 | $80,000 | $11,205 | $68,795 |
| 2016 | $2,200 | $82,922 | $11,205 | $71,717 |
| 2015 | $540 | $66,000 | $11,205 | $54,795 |
| 2014 | $540 | $41,960 | $11,205 | $30,755 |
Source: Public Records
Map
Nearby Homes
- 1615 Mosher Ln
- 1806 Saddle Rock Dr Unit 770
- 8835 Glenhouse Dr
- 1710 Beaver Bend Rd
- 1707 Winter Bay Ln
- 1330 Mosher Ln
- 1307 Saddle Rock Dr
- 1907 Bunzel St
- 8615 Citation Ct
- 9210 Glen Shadow Dr
- 9208 Ab Wheatley St
- 1559 Diplomat Way
- 9206 Ab Wheatley St
- 8718 Glen Shadow Dr
- 1326 Twin Falls Rd
- 2003 Deerhurst Ln
- 9010 Wheatley St
- 1054 Dewalt St
- 1102 Mosher Ln
- 9006 Winding River Dr
- 1506 Saddle Rock Dr
- 1514 Saddle Rock Dr
- 1511 Rainy River Dr
- 1515 Rainy River Dr
- 1507 Rainy River Dr
- 1602 Saddle Rock Dr
- 1502 Saddle Rock Dr
- 8830 Creeping Vine Ln
- 1603 Rainy River Dr
- 1503 Rainy River Dr
- 8847 Rutherford Ln
- 1606 Saddle Rock Dr
- 8826 Creeping Vine Ln
- 1607 Rainy River Dr
- 8843 Rutherford Ln
- 8831 Creeping Vine Ln
- 1610 Saddle Rock Dr
- 1442 Saddle Rock Dr
- 1510 Rainy River Dr Unit 770
- 1611 Rainy River Dr