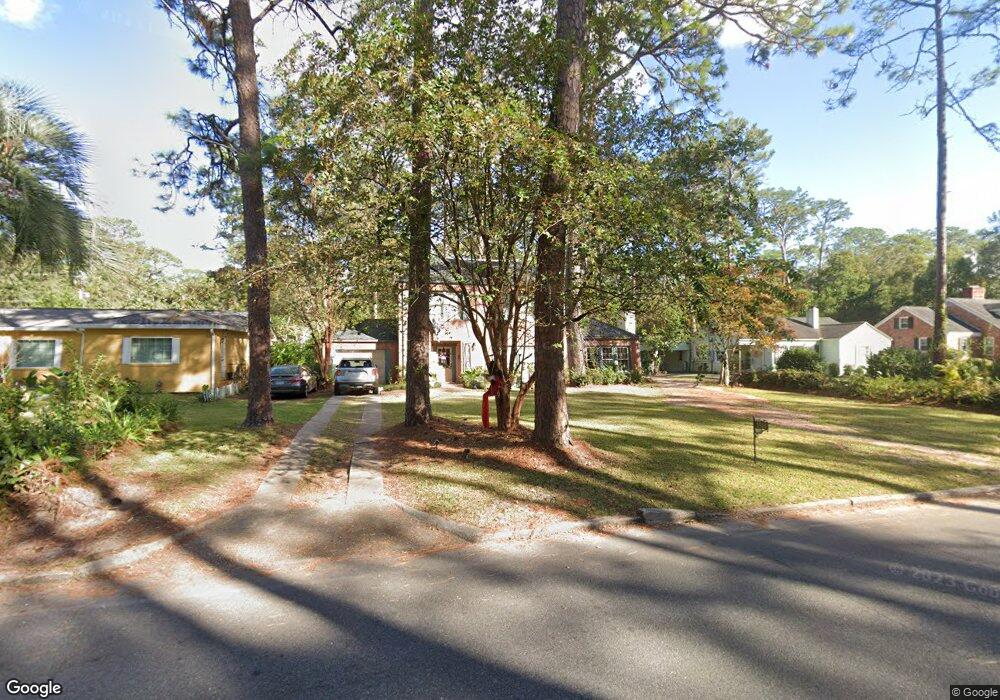
1510 Satilla Blvd Waycross, GA 31501
Estimated Value: $222,000 - $238,000
4
Beds
3
Baths
2,221
Sq Ft
$104/Sq Ft
Est. Value
About This Home
This home is located at 1510 Satilla Blvd, Waycross, GA 31501 and is currently estimated at $231,638, approximately $104 per square foot. 1510 Satilla Blvd is a home located in Ware County with nearby schools including Center Elementary School, Waycross Middle School, and Ware County High School.
Ownership History
Date
Name
Owned For
Owner Type
Purchase Details
Closed on
Nov 27, 2019
Sold by
Yarbrough Daniel K
Bought by
Gaskins Jessica
Current Estimated Value
Home Financials for this Owner
Home Financials are based on the most recent Mortgage that was taken out on this home.
Original Mortgage
$115,457
Outstanding Balance
$101,220
Interest Rate
3.7%
Mortgage Type
FHA
Estimated Equity
$130,418
Purchase Details
Closed on
Jun 7, 2016
Sold by
Murphy David P
Bought by
Yarbrough Candice and Yarbrough Daniel
Home Financials for this Owner
Home Financials are based on the most recent Mortgage that was taken out on this home.
Original Mortgage
$118,808
Interest Rate
4.12%
Mortgage Type
FHA
Purchase Details
Closed on
Dec 20, 2004
Sold by
Sweat Forrest W and Sweat Susan
Bought by
Murphy David P Dr
Purchase Details
Closed on
Jun 18, 1985
Create a Home Valuation Report for This Property
The Home Valuation Report is an in-depth analysis detailing your home's value as well as a comparison with similar homes in the area
Home Values in the Area
Average Home Value in this Area
Purchase History
| Date | Buyer | Sale Price | Title Company |
|---|---|---|---|
| Gaskins Jessica | $117,588 | -- | |
| Yarbrough Candice | $121,000 | -- | |
| Murphy David P Dr | $112,500 | -- | |
| -- | $46,900 | -- |
Source: Public Records
Mortgage History
| Date | Status | Borrower | Loan Amount |
|---|---|---|---|
| Open | Gaskins Jessica | $115,457 | |
| Previous Owner | Yarbrough Candice | $118,808 |
Source: Public Records
Tax History Compared to Growth
Tax History
| Year | Tax Paid | Tax Assessment Tax Assessment Total Assessment is a certain percentage of the fair market value that is determined by local assessors to be the total taxable value of land and additions on the property. | Land | Improvement |
|---|---|---|---|---|
| 2024 | $3,224 | $80,770 | $5,580 | $75,190 |
| 2023 | $2,785 | $69,708 | $3,134 | $66,574 |
| 2022 | $2,778 | $69,708 | $3,134 | $66,574 |
| 2021 | $2,343 | $54,185 | $3,134 | $51,051 |
| 2020 | $2,294 | $52,638 | $3,134 | $49,504 |
| 2019 | $1,715 | $41,809 | $3,134 | $38,675 |
| 2018 | $1,732 | $40,262 | $3,134 | $37,128 |
| 2017 | $1,755 | $40,262 | $3,134 | $37,128 |
| 2016 | $1,755 | $40,262 | $3,134 | $37,128 |
| 2015 | $1,768 | $40,261 | $3,134 | $37,128 |
| 2014 | $1,766 | $40,262 | $3,134 | $37,128 |
| 2013 | -- | $40,261 | $3,133 | $37,128 |
Source: Public Records
Map
Nearby Homes
- 706 Cherokee Cir
- 1701 Satilla Blvd
- 1500 Saint Marys Dr
- 707 Euclid Ave
- 0 Saint Marys Dr Unit (TRACT 2 0.25 ACRES)
- 1001 Coral Rd
- 907 Euclid Ave
- 1002 Cherokee Cir
- 1101 Cherokee Dr
- 511 Richmond Ave
- 1009 Euclid Ave
- 1011 Cherokee Cir
- 00 Pineview Dr
- 0 Pineview Dr
- 1100 Euclid Ave
- 903 Atlantic Ave
- 713 Magnolia Dr
- 1103 Kontz Ave
- 1205 Dean Dr
- 807 College St
- 1508 Satilla Blvd
- 1512 Satilla Blvd
- 1504 Satilla Blvd
- 1521 Saint Marys Dr
- 1519 Saint Marys Dr
- 1521 St Mary's Dr
- 703 Seminole Trail
- 1507 Saint Marys Dr
- 1602 St Mary's
- 1507 Satilla Blvd
- 1513 Satilla Blvd
- 1500 Satilla Blvd
- 700 Cherokee Cir
- 1501 Satilla Blvd
- 1520 Saint Marys Dr
- 1501 Saint Marys Dr
- 1617 Satilla Blvd
- 1516 Saint Marys Dr
- 1600 Saint Marys Dr
- 1600 St Mary's Dr