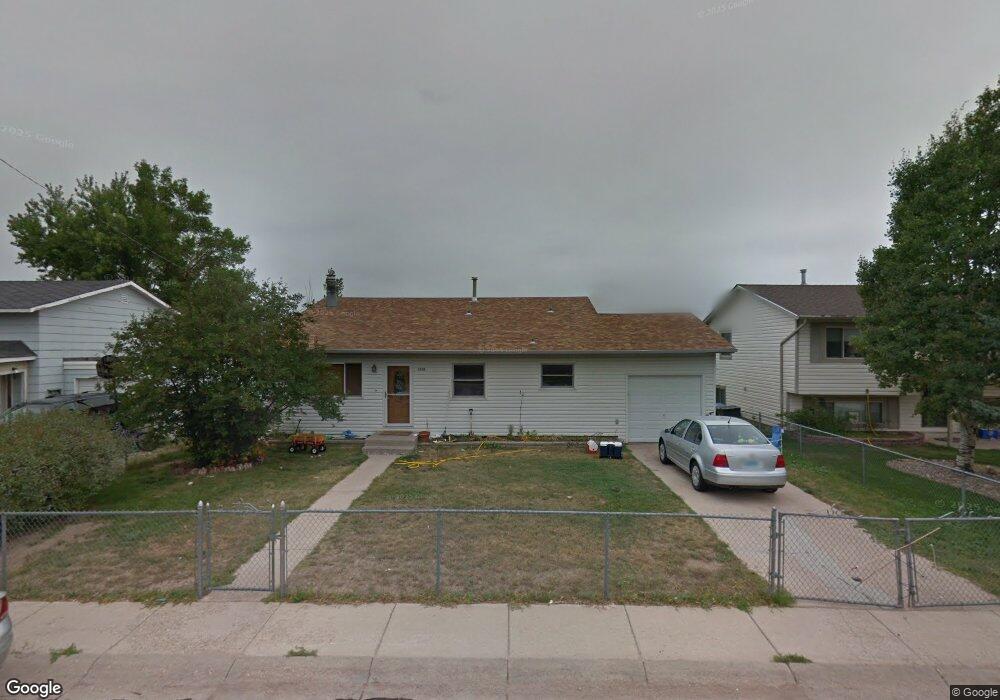
1510 W Allison Rd Cheyenne, WY 82007
Estimated Value: $311,000 - $337,000
4
Beds
2
Baths
1,512
Sq Ft
$214/Sq Ft
Est. Value
About This Home
This home is located at 1510 W Allison Rd, Cheyenne, WY 82007 and is currently estimated at $324,027, approximately $214 per square foot. 1510 W Allison Rd is a home located in Laramie County with nearby schools including Goins Elementary School, Johnson Junior High School, and South High School.
Ownership History
Date
Name
Owned For
Owner Type
Purchase Details
Closed on
Jun 15, 2011
Sold by
Chellew Deborah S
Bought by
Gray Scott M
Current Estimated Value
Home Financials for this Owner
Home Financials are based on the most recent Mortgage that was taken out on this home.
Original Mortgage
$148,117
Outstanding Balance
$102,444
Interest Rate
4.7%
Mortgage Type
VA
Estimated Equity
$221,583
Purchase Details
Closed on
Jun 17, 2002
Sold by
Franz James D and Franz Penny L
Bought by
Chellew Deborah S
Home Financials for this Owner
Home Financials are based on the most recent Mortgage that was taken out on this home.
Original Mortgage
$81,600
Interest Rate
6.77%
Purchase Details
Closed on
Sep 25, 1998
Sold by
Franz James D and Franz Penny L
Bought by
Franz James D and Franz Penny L
Home Financials for this Owner
Home Financials are based on the most recent Mortgage that was taken out on this home.
Original Mortgage
$49,800
Interest Rate
6.92%
Create a Home Valuation Report for This Property
The Home Valuation Report is an in-depth analysis detailing your home's value as well as a comparison with similar homes in the area
Home Values in the Area
Average Home Value in this Area
Purchase History
| Date | Buyer | Sale Price | Title Company |
|---|---|---|---|
| Gray Scott M | -- | None Available | |
| Chellew Deborah S | -- | -- | |
| Franz James D | -- | -- |
Source: Public Records
Mortgage History
| Date | Status | Borrower | Loan Amount |
|---|---|---|---|
| Open | Gray Scott M | $148,117 | |
| Previous Owner | Chellew Deborah S | $81,600 | |
| Previous Owner | Franz James D | $49,800 |
Source: Public Records
Tax History Compared to Growth
Tax History
| Year | Tax Paid | Tax Assessment Tax Assessment Total Assessment is a certain percentage of the fair market value that is determined by local assessors to be the total taxable value of land and additions on the property. | Land | Improvement |
|---|---|---|---|---|
| 2025 | $1,949 | $22,511 | $2,389 | $20,122 |
| 2024 | $1,949 | $30,559 | $3,185 | $27,374 |
| 2023 | $1,874 | $29,506 | $3,185 | $26,321 |
| 2022 | $1,685 | $26,349 | $3,185 | $23,164 |
| 2021 | $1,399 | $22,340 | $3,185 | $19,155 |
| 2020 | $1,300 | $21,020 | $3,185 | $17,835 |
| 2019 | $1,495 | $20,706 | $3,185 | $17,521 |
| 2018 | $1,267 | $17,710 | $2,406 | $15,304 |
| 2017 | $1,213 | $16,814 | $2,406 | $14,408 |
| 2016 | $1,139 | $15,771 | $2,348 | $13,423 |
| 2015 | $1,088 | $15,061 | $2,348 | $12,713 |
| 2014 | $1,067 | $14,678 | $2,348 | $12,330 |
Source: Public Records
Map
Nearby Homes
- 1504 Woodward Dr
- 1309 Ahrens Ave
- 1717 W Allison Rd
- 1600 Trail Way Rd
- TBD Wyott Dr
- 125 King Ct
- 1615 Alyssaelaine Dr
- 1724 Richard Martin Dr
- 1532 Richard Martin Dr
- 1712 Richard Martin Dr
- 1812 Richard Martin Dr
- 1808 Richard Martin Dr
- 1804 Richard Martin Dr
- 1800 Richard Martin Dr
- 205 Mccomb Ave
- 1621 Richard Martin Dr
- 227 Hynds Ave
- 240 Patton Ave
- 257 Mccomb Ave
- 302 Abby Rd
- 1514 W Allison Rd
- 1513 Woodward Dr
- 1520 W Allison Rd
- 1422 W Allison Rd
- 1519 Woodward Dr
- 1525 Woodward Dr
- 1503 Woodward Dr
- 1509 W Allison Rd
- 1526 W Allison Rd
- 1418 W Allison Rd
- 1513 W Allison Rd
- 1503 W Allison Rd
- 1519 W Allison Rd
- 1417 Woodward Dr
- 1525 W Allison Rd
- 1532 W Allison Rd
- 1412 W Allison Rd
- 1535 Woodward Dr
- 1411 Woodward Dr
- 1531 W Allison Rd