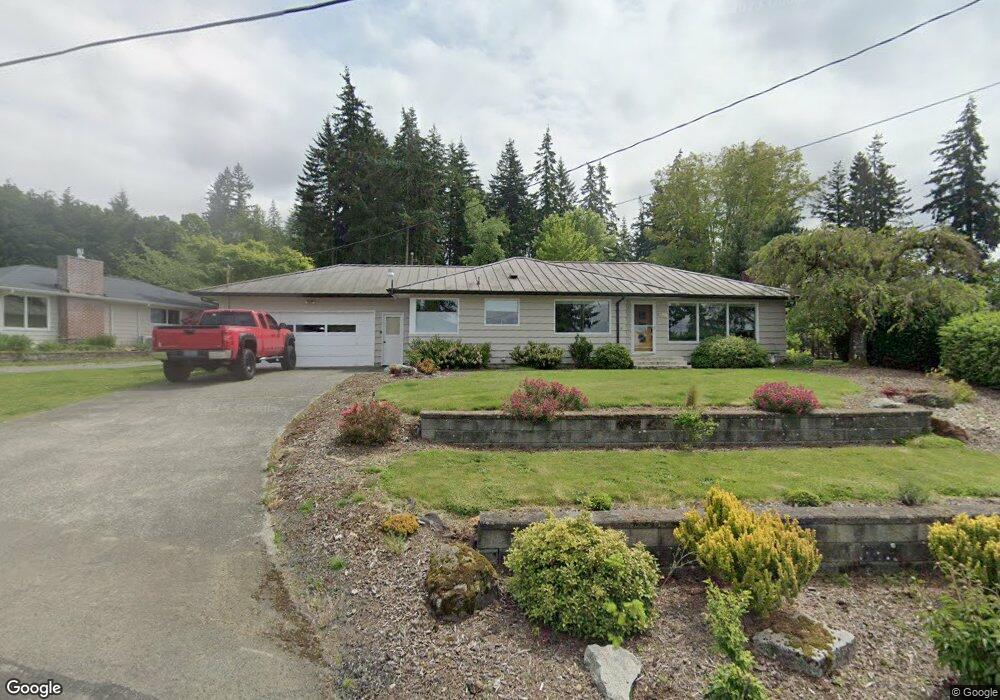
1510 Whatcom St Bellingham, WA 98229
Puget NeighborhoodEstimated Value: $642,000 - $825,073
2
Beds
1
Bath
1,398
Sq Ft
$536/Sq Ft
Est. Value
About This Home
This home is located at 1510 Whatcom St, Bellingham, WA 98229 and is currently estimated at $750,018, approximately $536 per square foot. 1510 Whatcom St is a home located in Whatcom County with nearby schools including Carl Cozier Elementary School, Kulshan Middle School, and Sehome High School.
Ownership History
Date
Name
Owned For
Owner Type
Purchase Details
Closed on
Dec 15, 2020
Sold by
Cranfill Richard E
Bought by
Richmond Gerald H and Richmond Brenda L
Current Estimated Value
Home Financials for this Owner
Home Financials are based on the most recent Mortgage that was taken out on this home.
Original Mortgage
$510,000
Outstanding Balance
$454,862
Interest Rate
2.8%
Mortgage Type
New Conventional
Estimated Equity
$295,156
Purchase Details
Closed on
Dec 3, 2020
Sold by
Cranfill Richard E
Bought by
Gerald And Brenda Richmond Living Trust and Richmond
Home Financials for this Owner
Home Financials are based on the most recent Mortgage that was taken out on this home.
Original Mortgage
$510,000
Outstanding Balance
$454,862
Interest Rate
2.8%
Mortgage Type
New Conventional
Estimated Equity
$295,156
Create a Home Valuation Report for This Property
The Home Valuation Report is an in-depth analysis detailing your home's value as well as a comparison with similar homes in the area
Home Values in the Area
Average Home Value in this Area
Purchase History
| Date | Buyer | Sale Price | Title Company |
|---|---|---|---|
| Richmond Gerald H | $600,000 | Whatcom Land Title | |
| Gerald And Brenda Richmond Living Trust | -- | Whatcom Land Title |
Source: Public Records
Mortgage History
| Date | Status | Borrower | Loan Amount |
|---|---|---|---|
| Open | Richmond Gerald H | $510,000 | |
| Closed | Gerald And Brenda Richmond Living Trust | $510,000 |
Source: Public Records
Tax History Compared to Growth
Tax History
| Year | Tax Paid | Tax Assessment Tax Assessment Total Assessment is a certain percentage of the fair market value that is determined by local assessors to be the total taxable value of land and additions on the property. | Land | Improvement |
|---|---|---|---|---|
| 2024 | $5,647 | $700,653 | $278,751 | $421,902 |
| 2023 | $5,647 | $725,703 | $288,717 | $436,986 |
| 2022 | $4,627 | $617,623 | $245,718 | $371,905 |
| 2021 | $4,300 | $498,097 | $198,165 | $299,932 |
| 2020 | $4,223 | $436,924 | $173,828 | $263,096 |
| 2019 | $4,567 | $414,735 | $165,000 | $249,735 |
| 2018 | $4,742 | $449,747 | $183,365 | $266,382 |
| 2017 | $3,627 | $399,213 | $162,760 | $236,453 |
| 2016 | $3,304 | $319,092 | $149,760 | $169,332 |
| 2015 | $3,252 | $302,623 | $141,960 | $160,663 |
| 2014 | -- | $288,205 | $135,200 | $153,005 |
| 2013 | -- | $275,926 | $130,000 | $145,926 |
Source: Public Records
Map
Nearby Homes
- 1227 Puget St
- 1501 Lakeway Dr
- 1401 Edwards St
- 0 Lopez St
- 1356 Orleans St
- 905 Queen St
- 1200 Lincoln St Unit 196
- 1200 Lincoln St Unit 117
- 1200 Lincoln St Unit 154
- 805 Nevada St
- 1142 Whidbey St
- 1146 Whidbey St
- 1101 Whidbey St
- 910 Gladstone St Unit 205
- 115 43rd St
- 143 S 44th St
- 2501 Fireweed Ln
- 1470 James St
- 1234 Grant St
- 0 Princeton Ct