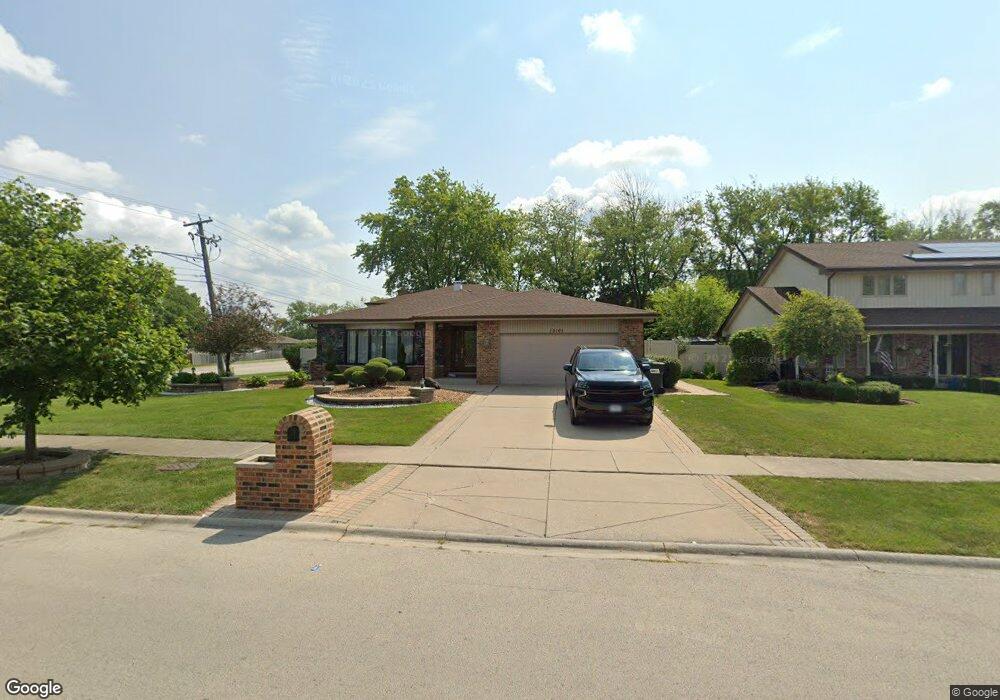
15101 Royal Georgian Rd Orland Park, IL 60462
Silver Lake South NeighborhoodEstimated Value: $408,934 - $455,000
3
Beds
2
Baths
1,488
Sq Ft
$285/Sq Ft
Est. Value
About This Home
This home is located at 15101 Royal Georgian Rd, Orland Park, IL 60462 and is currently estimated at $424,484, approximately $285 per square foot. 15101 Royal Georgian Rd is a home located in Cook County with nearby schools including Liberty Elementary School, Orland Center School, and Jerling Junior High School.
Ownership History
Date
Name
Owned For
Owner Type
Purchase Details
Closed on
Sep 18, 2024
Sold by
Taiym Essa and Ahmad Rawan R
Bought by
Taiym Essa and Ahmad Rawan R
Current Estimated Value
Purchase Details
Closed on
Jun 19, 2007
Sold by
Marquette Bank
Bought by
Taiym Essa
Purchase Details
Closed on
Feb 2, 2005
Sold by
Taiym Said R
Bought by
Marquette Bank and Trust #17249
Purchase Details
Closed on
Apr 2, 2004
Sold by
Labuda Robert J and Labuda Diane L
Bought by
Taiym Said R
Home Financials for this Owner
Home Financials are based on the most recent Mortgage that was taken out on this home.
Original Mortgage
$255,200
Interest Rate
5.63%
Mortgage Type
Unknown
Purchase Details
Closed on
Aug 12, 2002
Sold by
Labuda Robert J
Bought by
Labuda Robert J and Labuda Diane L
Home Financials for this Owner
Home Financials are based on the most recent Mortgage that was taken out on this home.
Original Mortgage
$175,000
Interest Rate
6.13%
Create a Home Valuation Report for This Property
The Home Valuation Report is an in-depth analysis detailing your home's value as well as a comparison with similar homes in the area
Home Values in the Area
Average Home Value in this Area
Purchase History
| Date | Buyer | Sale Price | Title Company |
|---|---|---|---|
| Taiym Essa | -- | Accommodation/Courtesy Recordi | |
| Taiym Essa | -- | None Available | |
| Marquette Bank | -- | -- | |
| Taiym Said R | $319,000 | Ticor Title Insurance Compan | |
| Labuda Robert J | -- | Lawyers Title Insurance Corp |
Source: Public Records
Mortgage History
| Date | Status | Borrower | Loan Amount |
|---|---|---|---|
| Previous Owner | Taiym Said R | $255,200 | |
| Previous Owner | Labuda Robert J | $175,000 | |
| Closed | Taiym Said R | $31,500 |
Source: Public Records
Tax History Compared to Growth
Tax History
| Year | Tax Paid | Tax Assessment Tax Assessment Total Assessment is a certain percentage of the fair market value that is determined by local assessors to be the total taxable value of land and additions on the property. | Land | Improvement |
|---|---|---|---|---|
| 2024 | $7,929 | $35,000 | $6,829 | $28,171 |
| 2023 | $6,392 | $35,000 | $6,829 | $28,171 |
| 2022 | $6,392 | $24,758 | $6,009 | $18,749 |
| 2021 | $6,199 | $24,758 | $6,009 | $18,749 |
| 2020 | $6,030 | $24,758 | $6,009 | $18,749 |
| 2019 | $5,635 | $23,959 | $5,463 | $18,496 |
| 2018 | $5,855 | $25,367 | $5,463 | $19,904 |
| 2017 | $5,738 | $25,367 | $5,463 | $19,904 |
| 2016 | $5,193 | $21,109 | $4,916 | $16,193 |
| 2015 | $5,109 | $21,109 | $4,916 | $16,193 |
| 2014 | $5,468 | $22,653 | $4,916 | $17,737 |
| 2013 | $6,060 | $26,273 | $4,916 | $21,357 |
Source: Public Records
Map
Nearby Homes
- 9180 136th St
- 8909 Silverdale Dr Unit 5C
- 9061 Somerset Ct Unit 16
- 8944 Fernwood Ct
- 9148 Clairmont Ct Unit 120
- 14739 Maple Ave
- 56 Orland Square Dr
- 15324 Regent Dr
- 14712 S 88th Ave
- 15336 Regent Dr
- 14759 Montgomery Dr
- 14746 Lakeview Dr
- 9205 Lake View Dr
- 9048 W 147th St
- 9203 Wheeler Dr
- 15633 Orlan Brook Dr
- 8624 Kendall Ln
- 14641 Birch St
- 8824 Carnoustie Dr
- 15511 Westminster Dr Unit 65B
- 15109 Royal Georgian Rd
- 15117 Royal Georgian Rd
- 8910 Huguelet Place
- 8906 Silverdale Dr Unit 4E
- 8902 Silverdale Dr Unit 4F
- 8900 Silverdale Dr Unit 4G
- 8908 Silverdale Dr Unit 4D
- 15125 Royal Georgian Rd
- 8912 Silverdale Dr Unit 4C
- 8914 Silverdale Dr Unit 4B
- 8922 Huguelet Place
- 15046 Castlebar Ln
- 8918 Silverdale Dr Unit 4A
- 8909 Huguelet Place
- 14355 94th Ave
- 9248 Harlowe #2 01 Ln
- 9246 Harlowe Lot #2 02 Ln
- 17237 S Wolf Rd
- LOT 69 Silo Ridge
- 14523 Pheasent Trail