15102 272nd St E Graham, WA 98338
Estimated Value: $892,000 - $1,333,000
3
Beds
2
Baths
2,129
Sq Ft
$509/Sq Ft
Est. Value
About This Home
This home is located at 15102 272nd St E, Graham, WA 98338 and is currently estimated at $1,082,824, approximately $508 per square foot. 15102 272nd St E is a home located in Pierce County with nearby schools including Kapowsin Elementary School, Frontier Middle School, and Graham Kapowsin High School.
Ownership History
Date
Name
Owned For
Owner Type
Purchase Details
Closed on
Apr 5, 2006
Sold by
Zitka Peter P and Zitka Terrill R
Bought by
Evans James M and Evans Virginia E
Current Estimated Value
Home Financials for this Owner
Home Financials are based on the most recent Mortgage that was taken out on this home.
Original Mortgage
$200,000
Interest Rate
6.2%
Mortgage Type
Fannie Mae Freddie Mac
Purchase Details
Closed on
Feb 3, 2000
Sold by
Vance Karen Swartwout
Bought by
Zitka Peter P and Zitka Terrill R
Purchase Details
Closed on
Mar 3, 1997
Sold by
Vance Karen Swartwout
Bought by
Zitka Peter P and Zitka Terrill R
Home Financials for this Owner
Home Financials are based on the most recent Mortgage that was taken out on this home.
Original Mortgage
$66,000
Interest Rate
10%
Create a Home Valuation Report for This Property
The Home Valuation Report is an in-depth analysis detailing your home's value as well as a comparison with similar homes in the area
Home Values in the Area
Average Home Value in this Area
Purchase History
| Date | Buyer | Sale Price | Title Company |
|---|---|---|---|
| Evans James M | $619,000 | The Talon Group | |
| Zitka Peter P | -- | Commonwealth Title Co | |
| Zitka Peter P | $86,000 | Commonwealth Title Company |
Source: Public Records
Mortgage History
| Date | Status | Borrower | Loan Amount |
|---|---|---|---|
| Closed | Evans James M | $200,000 | |
| Previous Owner | Zitka Peter P | $66,000 |
Source: Public Records
Tax History Compared to Growth
Tax History
| Year | Tax Paid | Tax Assessment Tax Assessment Total Assessment is a certain percentage of the fair market value that is determined by local assessors to be the total taxable value of land and additions on the property. | Land | Improvement |
|---|---|---|---|---|
| 2025 | $9,486 | $899,400 | $302,300 | $597,100 |
| 2024 | $9,486 | $878,300 | $302,300 | $576,000 |
| 2023 | $9,486 | $826,600 | $320,400 | $506,200 |
| 2022 | $8,297 | $790,600 | $320,400 | $470,200 |
| 2021 | $7,735 | $558,500 | $206,100 | $352,400 |
| 2019 | $6,030 | $519,600 | $173,800 | $345,800 |
| 2018 | $6,737 | $495,400 | $165,700 | $329,700 |
| 2017 | $6,105 | $441,700 | $129,900 | $311,800 |
| 2016 | $5,572 | $373,600 | $112,300 | $261,300 |
| 2014 | $4,899 | $331,700 | $101,400 | $230,300 |
| 2013 | $4,899 | $320,500 | $112,300 | $208,200 |
Source: Public Records
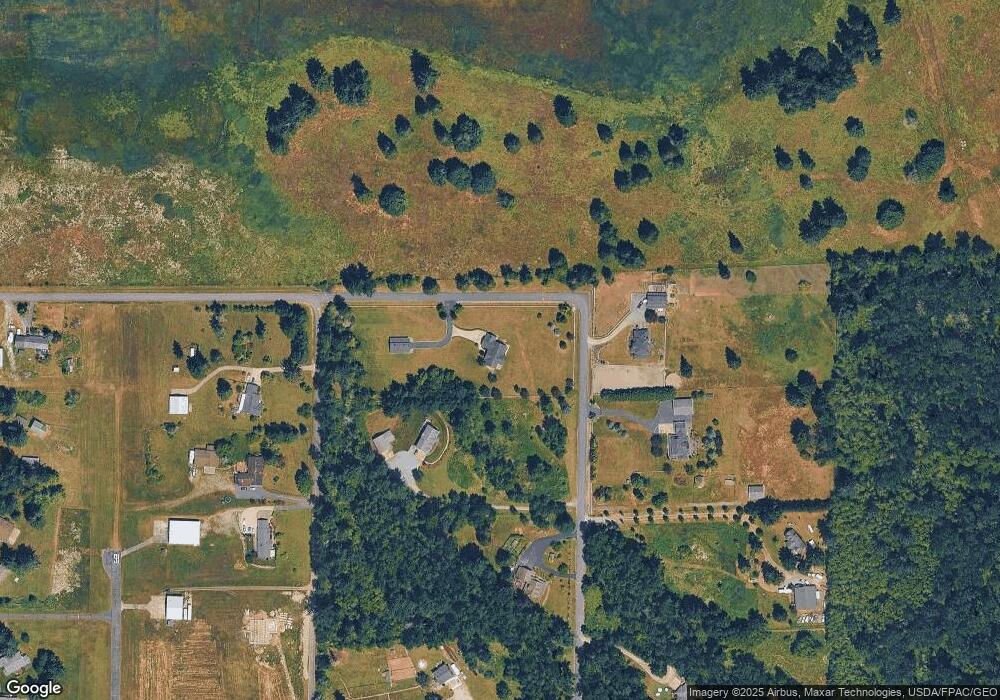
Map
Nearby Homes
- 26908 159th Ave E
- 27215 159th Ave E
- 15625 264th St E
- 25867 150th Ave E
- 15407 264th St E
- 26707 Orville Rd E
- 29512 152nd Ave E
- 29555 150th Ave E
- 0 128th Avenue Ct E Unit NWM2409850
- 12805 276th St E
- 15419 296th St E
- 14512 246th St E
- 24608 158th Ave E
- 12519 288th St E
- 0 Orville Rd E Unit NWM2235863
- 12016 264th St E
- 16115 243rd St E
- 15809 239th St E
- 0 134th Ave E Unit NWM2402677
- 31410 Orville Rd E
- 27207 152nd Ave E
- 27315 152nd Ave E
- 27408 152nd Ave E
- 27210 150th Ave E
- 27308 150th Ave E
- 27404 150th Ave E
- 27510 152nd Ave E
- 27409 152nd Ave E
- 27502 150th Ave E
- 27511 152nd Ave E
- 27323 146th Ave E
- 27605 152nd Ave E
- 27209 146th Ave E
- 14716 275th St E
- 27702 152nd Ave E
- 27701 152nd Ave E
- 27419 146th Ave E
- 14610 275th St E
- 27716 150th Ave E
- 27611 146th Ave E