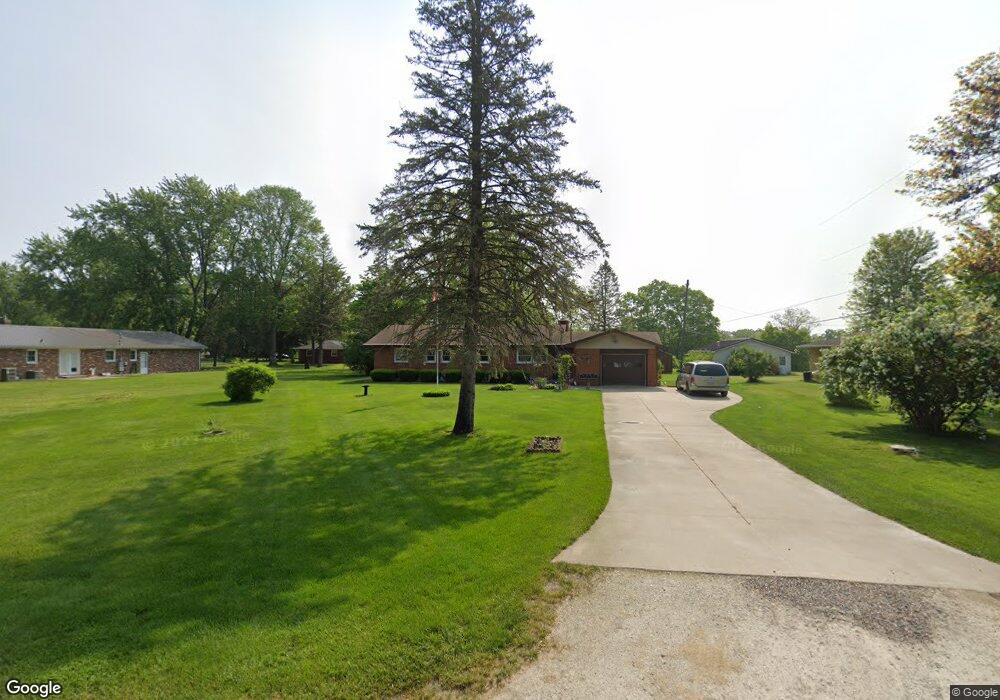
15105 Connie St Constantine, MI 49042
Estimated Value: $206,000 - $236,000
3
Beds
2
Baths
1,269
Sq Ft
$174/Sq Ft
Est. Value
About This Home
This home is located at 15105 Connie St, Constantine, MI 49042 and is currently estimated at $220,626, approximately $173 per square foot. 15105 Connie St is a home located in St. Joseph County with nearby schools including Eastside Elementary School, Riverside Elementary School, and Constantine Middle School.
Ownership History
Date
Name
Owned For
Owner Type
Purchase Details
Closed on
May 11, 2007
Sold by
Hubbard Robert L and Hubbard Janice C
Bought by
Hubbard Robert L and Hubbard Janice C
Current Estimated Value
Purchase Details
Closed on
Oct 29, 2005
Sold by
Wayne E & Shirley T Thornburgh Trust
Bought by
Hubbard Robert L and Hubbard Janice C
Home Financials for this Owner
Home Financials are based on the most recent Mortgage that was taken out on this home.
Original Mortgage
$82,000
Interest Rate
5.89%
Mortgage Type
Fannie Mae Freddie Mac
Purchase Details
Closed on
Sep 22, 2002
Sold by
Thornburgh Shirley T-Trustee
Bought by
Thornburgh Shirley T Trust
Purchase Details
Closed on
Sep 19, 2000
Sold by
Thornburgh Wayne E and Thornburgh Shirley
Bought by
Thornburgh Shirley T-Trustee
Purchase Details
Closed on
Jul 25, 1991
Sold by
Thornburgh Wayne E and Thornburgh Shirley T
Bought by
Thornburgh Shirley T-Trustee
Create a Home Valuation Report for This Property
The Home Valuation Report is an in-depth analysis detailing your home's value as well as a comparison with similar homes in the area
Purchase History
| Date | Buyer | Sale Price | Title Company |
|---|---|---|---|
| Hubbard Robert L | -- | None Available | |
| Hubbard Robert L | $102,500 | Vt | |
| Thornburgh Shirley T Trust | -- | -- | |
| Thornburgh Shirley T-Trustee | -- | -- | |
| Thornburgh Shirley T-Trustee | -- | -- |
Source: Public Records
Mortgage History
| Date | Status | Borrower | Loan Amount |
|---|---|---|---|
| Closed | Hubbard Robert L | $82,000 |
Source: Public Records
Tax History
| Year | Tax Paid | Tax Assessment Tax Assessment Total Assessment is a certain percentage of the fair market value that is determined by local assessors to be the total taxable value of land and additions on the property. | Land | Improvement |
|---|---|---|---|---|
| 2025 | $597 | $88,400 | $8,300 | $80,100 |
| 2024 | $581 | $77,000 | $8,300 | $68,700 |
| 2023 | $554 | $67,800 | $8,300 | $59,500 |
| 2022 | $0 | $64,400 | $8,300 | $56,100 |
| 2021 | $1,353 | $59,900 | $11,400 | $48,500 |
| 2020 | $505 | $53,800 | $11,400 | $42,400 |
| 2019 | $1,374 | $49,400 | $11,400 | $38,000 |
| 2018 | $1,285 | $49,800 | $11,400 | $38,400 |
| 2017 | $1,247 | $44,900 | $44,900 | $0 |
| 2016 | -- | $45,600 | $45,600 | $0 |
| 2015 | -- | $52,500 | $0 | $0 |
| 2014 | -- | $49,800 | $49,800 | $0 |
| 2012 | -- | $47,900 | $47,900 | $0 |
Source: Public Records
Map
Nearby Homes
- 64588 W North Park Dr
- 303 Spring St
- 130 E Water St
- 380 Centreville Rd
- 365 White Pigeon St
- 265 W Water St
- 135 Jeremy St
- 755 White Pigeon Rd
- 460 Green St
- 63779 Youngs Prairie Rd
- 12901 Millers Mill Rd
- 17022 Hull St
- 67234 Blue School Rd
- 13540 Riverside Dr
- 66991 Winding River Rd
- 67118 Oxbow Dr
- 13064 Riverside Dr
- 0 Shorewood Lot 1 Dr Unit 26009009
- 0 Shorewood Dr Unit Lot 2
- 106 Prairie Ave
- 15099 Connie St
- 15097 Connie St
- 15097 Connie St
- 15086 Connie St
- 64779 Us Highway 131 N
- 64779 Us Highway 131 N
- 15103 S Northpark Dr
- 15133 S Northpark Dr
- 64634 W Northpark Dr
- 64785 Us Highway 131 N
- 15088 Sandra Dr
- 64629 E Northpark Dr
- 64608 W Northpark Dr
- 280 S Washington St
- 64605 E Northpark Dr
- 64585 W Northpark Dr
- 64585 W Northpark Dr
- 64604 E Northpark Dr
- 15026 Sandra Dr
- 64588 W Northpark Dr
Your Personal Tour Guide
Ask me questions while you tour the home.