15107 Falmouth Ave Houston, TX 77084
Eldridge North NeighborhoodEstimated Value: $289,000 - $336,000
3
Beds
3
Baths
2,160
Sq Ft
$142/Sq Ft
Est. Value
About This Home
This home is located at 15107 Falmouth Ave, Houston, TX 77084 and is currently estimated at $306,448, approximately $141 per square foot. 15107 Falmouth Ave is a home located in Harris County with nearby schools including Horne Elementary School, Truitt Middle School, and Cypress Falls High School.
Ownership History
Date
Name
Owned For
Owner Type
Purchase Details
Closed on
Jun 19, 2017
Sold by
Dunlap Michael
Bought by
Ortega Juan and Ortega Martha
Current Estimated Value
Home Financials for this Owner
Home Financials are based on the most recent Mortgage that was taken out on this home.
Original Mortgage
$171,830
Outstanding Balance
$142,927
Interest Rate
4.02%
Mortgage Type
FHA
Estimated Equity
$163,521
Purchase Details
Closed on
Jul 24, 2015
Sold by
Martinez Juan and Martinez Melania V
Bought by
Dunlap Michael and Michael Dunlap Ed Family Trust
Purchase Details
Closed on
Nov 12, 2002
Sold by
Kb Home Lone Star Lp
Bought by
Martinez Juan and Martinez Melania
Home Financials for this Owner
Home Financials are based on the most recent Mortgage that was taken out on this home.
Original Mortgage
$119,529
Interest Rate
5.89%
Mortgage Type
FHA
Create a Home Valuation Report for This Property
The Home Valuation Report is an in-depth analysis detailing your home's value as well as a comparison with similar homes in the area
Home Values in the Area
Average Home Value in this Area
Purchase History
| Date | Buyer | Sale Price | Title Company |
|---|---|---|---|
| Ortega Juan | -- | Stewart Title | |
| Dunlap Michael | -- | Attorney | |
| Martinez Juan | -- | First American Title |
Source: Public Records
Mortgage History
| Date | Status | Borrower | Loan Amount |
|---|---|---|---|
| Open | Ortega Juan | $171,830 | |
| Previous Owner | Martinez Juan | $119,529 |
Source: Public Records
Tax History Compared to Growth
Tax History
| Year | Tax Paid | Tax Assessment Tax Assessment Total Assessment is a certain percentage of the fair market value that is determined by local assessors to be the total taxable value of land and additions on the property. | Land | Improvement |
|---|---|---|---|---|
| 2025 | $145 | $294,769 | $53,921 | $240,848 |
| 2024 | $145 | $317,038 | $48,905 | $268,133 |
| 2023 | $145 | $312,436 | $48,905 | $263,531 |
| 2022 | $5,921 | $274,726 | $37,619 | $237,107 |
| 2021 | $5,685 | $219,432 | $37,619 | $181,813 |
| 2020 | $5,481 | $209,026 | $25,080 | $183,946 |
| 2019 | $5,204 | $182,218 | $21,668 | $160,550 |
| 2018 | $1,328 | $177,800 | $21,668 | $156,132 |
| 2017 | $5,114 | $177,800 | $21,668 | $156,132 |
| 2016 | $4,804 | $167,035 | $21,668 | $145,367 |
| 2015 | $3,223 | $144,229 | $21,668 | $122,561 |
| 2014 | $3,223 | $136,370 | $21,668 | $114,702 |
Source: Public Records
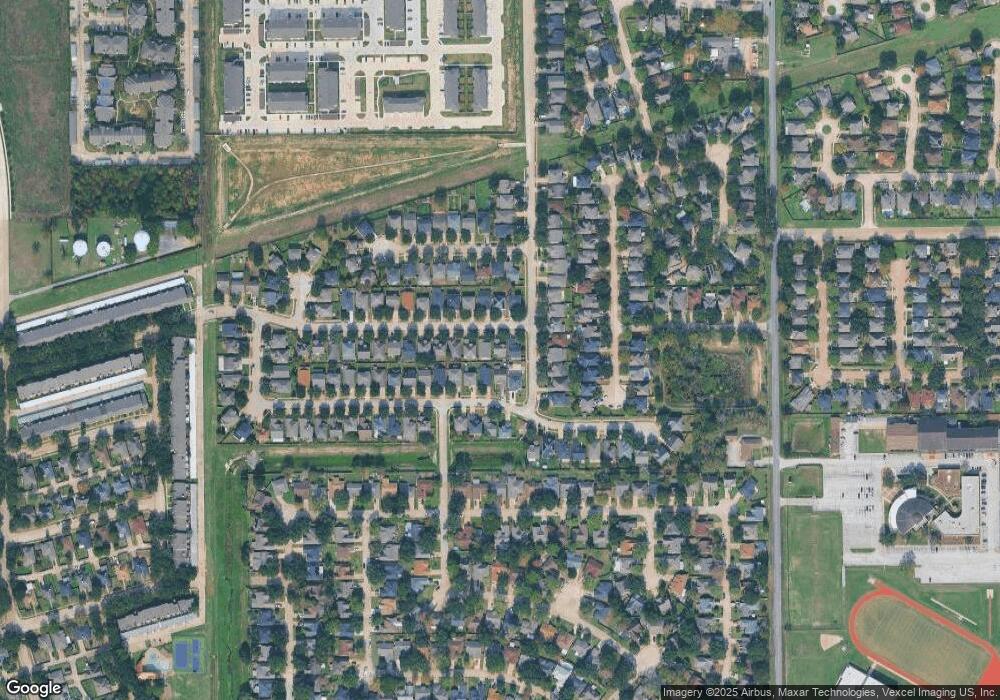
Map
Nearby Homes
- 6702 Shining Sumac Ave
- 6735 Cleft Stone Dr
- 15230 Weeping Cedar Ln
- 6614 Readsland Ln
- 6718 Wild Pecan Trail
- 15312 Falmouth Ave Unit 406
- 15039 Ringfield Dr
- 15326 Gorham Dr
- 6827 Hollow Hearth Dr
- 15338 Falmouth Ave Unit 1/419
- 6831 Hollow Hearth Dr
- 6505 Alisa Ln
- 6667 Kentwick Dr Unit 219
- 6473 Alisa Ln
- 6471 Alisa Ln
- 6434 Kentwick Dr Unit 24
- 14731 Blooming Jasmine Trail
- 14721 Blooming Jasmine Trail
- 14729 Blooming Jasmine Trail
- 14719 Blooming Jasmine Trail
- 15103 Falmouth Ave
- 15111 Falmouth Ave
- 15115 Falmouth Ave
- 15106 Weeping Cedar Ln
- 15110 Weeping Cedar Ln
- 15114 Weeping Cedar Ln
- 15106 Falmouth Ave
- 15119 Falmouth Ave
- 15110 Falmouth Ave
- 15102 Falmouth Ave
- 15114 Falmouth Ave
- 15118 Weeping Cedar Ln
- 6718 Shining Sumac Ave
- 6714 Shining Sumac Ave
- 6722 Shining Sumac Ave
- 6710 Shining Sumac Ave
- 15203 Falmouth Ave
- 15118 Falmouth Ave
- 6726 Shining Sumac Ave
- 6706 Shining Sumac Ave