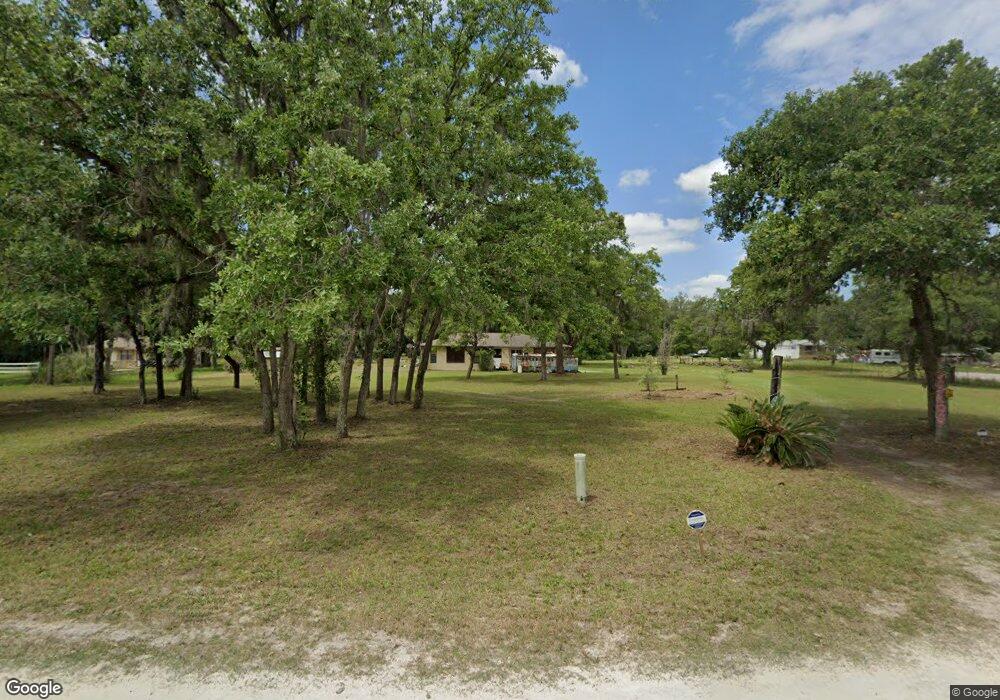
15108 Garson Loop Spring Hill, FL 34610
Estimated Value: $252,000 - $365,000
3
Beds
2
Baths
2,243
Sq Ft
$139/Sq Ft
Est. Value
About This Home
This home is located at 15108 Garson Loop, Spring Hill, FL 34610 and is currently estimated at $310,928, approximately $138 per square foot. 15108 Garson Loop is a home located in Pasco County with nearby schools including Dr. Mary Giella Elementary School, Crews Lake Middle School, and Hudson High School.
Ownership History
Date
Name
Owned For
Owner Type
Purchase Details
Closed on
Dec 16, 2020
Sold by
Hovis Nicole and Estate Of Granville Earl Turne
Bought by
Choice I Real Estate Investments Llc
Current Estimated Value
Purchase Details
Closed on
Mar 12, 2009
Sold by
Haynes Nicole S and Turner Amanda G
Bought by
Turner Granville E
Purchase Details
Closed on
Oct 5, 2008
Sold by
Turner Amanda
Bought by
Turner Granville Earl
Purchase Details
Closed on
Dec 30, 1997
Sold by
Barnett Bank Na
Bought by
Arnstein Paul C and Arnstein Phyllis A
Home Financials for this Owner
Home Financials are based on the most recent Mortgage that was taken out on this home.
Original Mortgage
$28,876
Interest Rate
7.23%
Mortgage Type
New Conventional
Purchase Details
Closed on
Feb 10, 1997
Sold by
Clerk Of The Court
Bought by
Barnett Bank
Create a Home Valuation Report for This Property
The Home Valuation Report is an in-depth analysis detailing your home's value as well as a comparison with similar homes in the area
Home Values in the Area
Average Home Value in this Area
Purchase History
| Date | Buyer | Sale Price | Title Company |
|---|---|---|---|
| Choice I Real Estate Investments Llc | $20,000 | South Oak Ttl Panama City Be | |
| Turner Granville E | -- | Attorney | |
| Turner Granville Earl | -- | None Available | |
| Arnstein Paul C | $30,500 | -- | |
| Barnett Bank | $100 | -- |
Source: Public Records
Mortgage History
| Date | Status | Borrower | Loan Amount |
|---|---|---|---|
| Previous Owner | Barnett Bank | $38,000 | |
| Previous Owner | Barnett Bank | $28,876 |
Source: Public Records
Tax History
| Year | Tax Paid | Tax Assessment Tax Assessment Total Assessment is a certain percentage of the fair market value that is determined by local assessors to be the total taxable value of land and additions on the property. | Land | Improvement |
|---|---|---|---|---|
| 2026 | $3,001 | $196,207 | $31,643 | $164,564 |
| 2025 | $3,001 | $196,207 | $31,643 | $164,564 |
| 2024 | $3,001 | $181,138 | $28,691 | $152,447 |
| 2023 | $2,752 | $141,530 | $0 | $0 |
| 2022 | $2,260 | $141,353 | $24,596 | $116,757 |
| 2021 | $2,022 | $115,515 | $20,069 | $95,446 |
| 2020 | $930 | $88,110 | $20,069 | $68,041 |
| 2019 | $902 | $86,130 | $0 | $0 |
| 2018 | $876 | $84,526 | $0 | $0 |
| 2017 | $865 | $84,526 | $0 | $0 |
| 2016 | $809 | $81,084 | $0 | $0 |
| 2015 | $819 | $80,520 | $0 | $0 |
| 2014 | $790 | $82,061 | $19,439 | $62,622 |
Source: Public Records
Map
Nearby Homes
- 17221 Nicks Dr
- 16314 Tiger Trail
- 14582 Boland Ave
- 15053 Peace Blvd
- 16347 Albright Rd
- 0 Bosley Dr
- 15542 Peace Blvd
- 14410 Dabney Ct
- 16870 Akins Dr
- 14822 Dilbeck Dr
- 17222 Dansville Dr
- 16837 Lashua Dr
- 14621 Dilbeck Dr
- 17059 Nokota Ave
- 16040 Platinum Dr
- 16031 Donney Moor Ln
- 0 Akins Dr Unit MFRW7882315
- 0 Akins Dr Unit 2257724
- 16403 Bosley Dr
- 15616 Larry Rd
- 15128 Garson Loop
- 15129 Garson Loop
- 15000 Garson Loop
- 15135 Garson Loop
- 16850 Nicks Dr
- 15125 Garson Loop
- 14930 Garson Loop
- 15201 Little Ranch Rd
- 15025 Little Ranch Rd
- 14951 Little Ranch Rd
- 15129 Little Ranch Rd
- 16636 Tiger Trail
- 16941 Nicks Dr
- 15026 Little Ranch Rd
- 15001 Garson Loop
- 14937 Garson Loop
- 0 Litte Ranch Unit W7800922
- 14567 Little Ranch Rd
- 00 Little Ranch Rd
- 16745 Tiger Trail
Your Personal Tour Guide
Ask me questions while you tour the home.