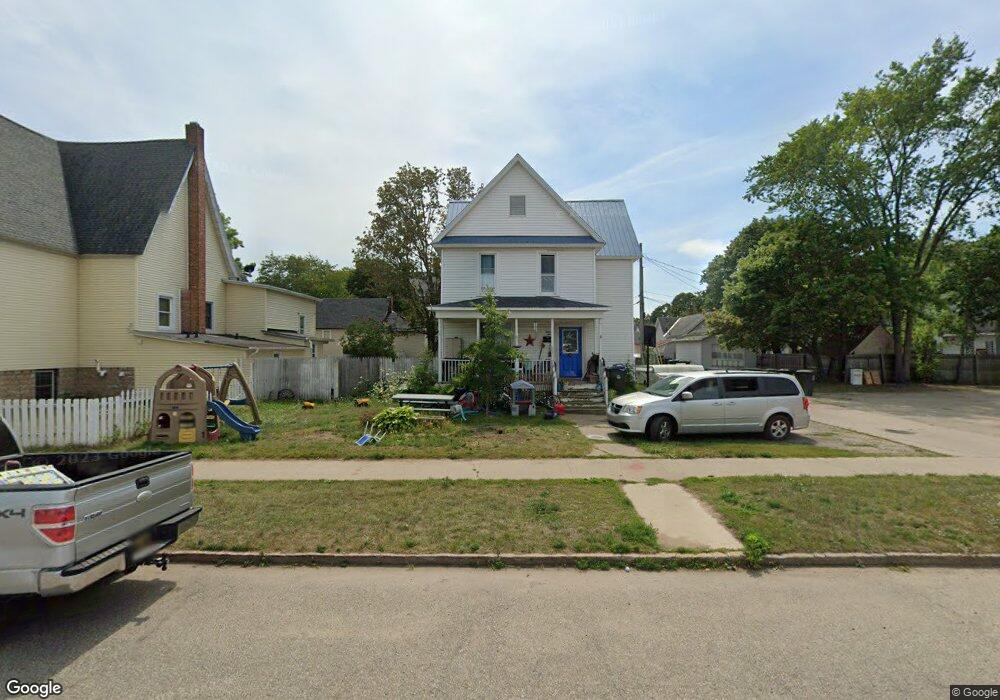
1511 1st Ave S Escanaba, MI 49829
Estimated Value: $116,000 - $145,000
4
Beds
2
Baths
1,758
Sq Ft
$76/Sq Ft
Est. Value
About This Home
This home is located at 1511 1st Ave S, Escanaba, MI 49829 and is currently estimated at $133,123, approximately $75 per square foot. 1511 1st Ave S is a home located in Delta County with nearby schools including Escanaba Jr./Sr. High School, Holy Name Catholic School, and Escanaba Sda School.
Ownership History
Date
Name
Owned For
Owner Type
Purchase Details
Closed on
Oct 29, 2010
Sold by
Sullivan Thomas J and Stacey Carolyn M
Bought by
Furner John and Furner Krisin
Current Estimated Value
Home Financials for this Owner
Home Financials are based on the most recent Mortgage that was taken out on this home.
Original Mortgage
$79,560
Outstanding Balance
$52,599
Interest Rate
4.31%
Mortgage Type
Unknown
Estimated Equity
$80,524
Purchase Details
Closed on
Mar 28, 2008
Sold by
Sfjv 2005 Llc
Bought by
Sullivan Thomas J
Purchase Details
Closed on
Dec 15, 2006
Sold by
Delta County Sheriff Department
Bought by
Sfjv 2005
Create a Home Valuation Report for This Property
The Home Valuation Report is an in-depth analysis detailing your home's value as well as a comparison with similar homes in the area
Home Values in the Area
Average Home Value in this Area
Purchase History
| Date | Buyer | Sale Price | Title Company |
|---|---|---|---|
| Furner John | -- | -- | |
| Sullivan Thomas J | $20,000 | -- | |
| Sfjv 2005 | $49,500 | -- | |
| Sfjv 2005 | $49,500 | -- |
Source: Public Records
Mortgage History
| Date | Status | Borrower | Loan Amount |
|---|---|---|---|
| Open | Furner John | $79,560 |
Source: Public Records
Tax History Compared to Growth
Tax History
| Year | Tax Paid | Tax Assessment Tax Assessment Total Assessment is a certain percentage of the fair market value that is determined by local assessors to be the total taxable value of land and additions on the property. | Land | Improvement |
|---|---|---|---|---|
| 2025 | $1,130 | $49,900 | $0 | $0 |
| 2024 | $859 | $43,000 | $0 | $0 |
| 2023 | $819 | $37,600 | $0 | $0 |
| 2022 | $1,066 | $34,900 | $0 | $0 |
| 2021 | $1,028 | $33,400 | $0 | $0 |
| 2020 | $1,018 | $33,600 | $0 | $0 |
| 2019 | $986 | $31,400 | $0 | $0 |
| 2018 | $963 | $31,800 | $0 | $0 |
| 2017 | $703 | $30,926 | $0 | $0 |
| 2016 | $924 | $32,038 | $0 | $0 |
| 2014 | $673 | $31,635 | $0 | $0 |
| 2013 | $673 | $30,948 | $0 | $0 |
Source: Public Records
Map
Nearby Homes