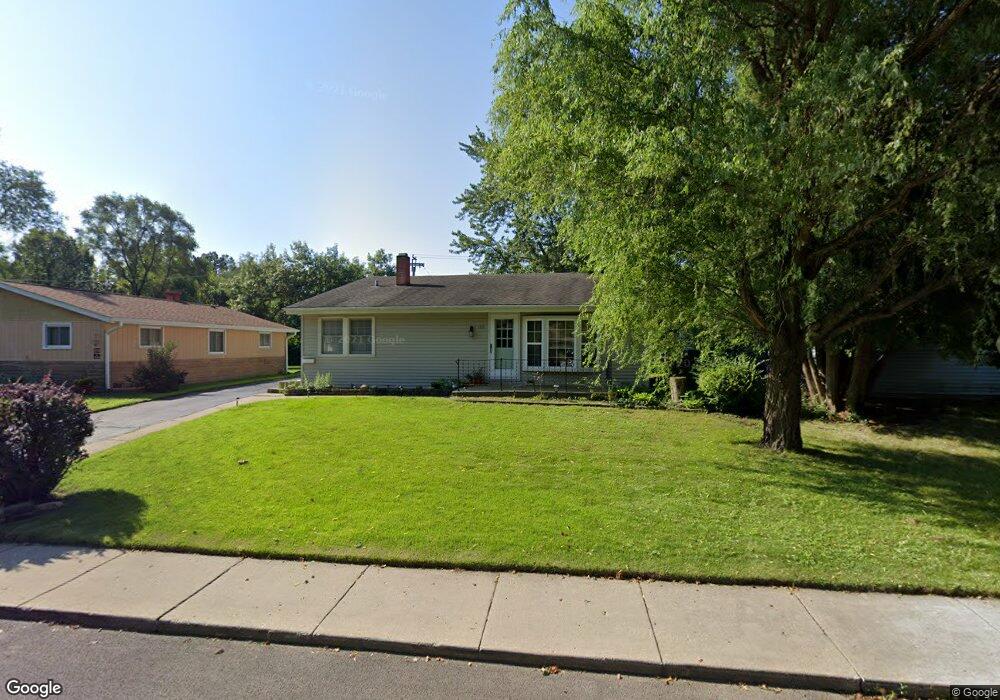
1511 Amarillo Dr Carpentersville, IL 60110
Estimated Value: $264,322 - $299,000
3
Beds
--
Bath
1,628
Sq Ft
$176/Sq Ft
Est. Value
About This Home
This home is located at 1511 Amarillo Dr, Carpentersville, IL 60110 and is currently estimated at $285,831, approximately $175 per square foot. 1511 Amarillo Dr is a home located in Kane County with nearby schools including Lakewood School, Crescent City Grade School, and Carpentersville Middle School.
Ownership History
Date
Name
Owned For
Owner Type
Purchase Details
Closed on
Aug 31, 2005
Sold by
Alvarez Manuel and Alvarez Alma Y
Bought by
Maldonado Rafael
Current Estimated Value
Home Financials for this Owner
Home Financials are based on the most recent Mortgage that was taken out on this home.
Original Mortgage
$145,600
Outstanding Balance
$81,528
Interest Rate
6.6%
Mortgage Type
Purchase Money Mortgage
Estimated Equity
$204,303
Purchase Details
Closed on
Aug 22, 1997
Sold by
Oneill Joann M and Pollman Paula W
Bought by
Alvarez Manuel and Alvarez Alma Y
Home Financials for this Owner
Home Financials are based on the most recent Mortgage that was taken out on this home.
Original Mortgage
$87,300
Interest Rate
7.54%
Purchase Details
Closed on
Feb 17, 1997
Sold by
Walczak Hilda A
Bought by
Walczak Hilda A and Hilda A Walczak Declaration Of Trust
Create a Home Valuation Report for This Property
The Home Valuation Report is an in-depth analysis detailing your home's value as well as a comparison with similar homes in the area
Home Values in the Area
Average Home Value in this Area
Purchase History
| Date | Buyer | Sale Price | Title Company |
|---|---|---|---|
| Maldonado Rafael | $182,000 | -- | |
| Alvarez Manuel | $60,000 | Premier Title Company | |
| Walczak Hilda A | -- | -- |
Source: Public Records
Mortgage History
| Date | Status | Borrower | Loan Amount |
|---|---|---|---|
| Open | Maldonado Rafael | $145,600 | |
| Previous Owner | Alvarez Manuel | $87,300 |
Source: Public Records
Tax History Compared to Growth
Tax History
| Year | Tax Paid | Tax Assessment Tax Assessment Total Assessment is a certain percentage of the fair market value that is determined by local assessors to be the total taxable value of land and additions on the property. | Land | Improvement |
|---|---|---|---|---|
| 2024 | $5,129 | $75,718 | $12,553 | $63,165 |
| 2023 | $5,052 | $68,129 | $11,295 | $56,834 |
| 2022 | $4,738 | $60,415 | $11,295 | $49,120 |
| 2021 | $4,624 | $57,044 | $10,665 | $46,379 |
| 2020 | $4,546 | $55,761 | $10,425 | $45,336 |
| 2019 | $4,441 | $52,935 | $9,897 | $43,038 |
| 2018 | $4,283 | $49,158 | $9,701 | $39,457 |
| 2017 | $4,101 | $45,985 | $9,075 | $36,910 |
| 2016 | $3,765 | $40,226 | $8,787 | $31,439 |
| 2015 | -- | $32,834 | $8,234 | $24,600 |
| 2014 | -- | $29,365 | $8,007 | $21,358 |
| 2013 | -- | $30,264 | $8,252 | $22,012 |
Source: Public Records
Map
Nearby Homes
- 1426 Kings Rd
- 105 Siesta Rd
- 140 Hickory Dr
- 200 Amarillo Dr
- 171 Lake Shore Dr
- 103 Hickory Dr
- 149 Austin Ave
- 308 Amarillo Ct
- 181 Skyline Dr
- 7 Austin Ave
- 327 Tulsa Ave
- 4 Austin Ave
- 57 Robin Rd
- 944 Cortney Dr
- 2013 Silverstone Dr Unit 2013
- 1431 Silverstone Dr Unit 1416
- 7 Hickory Dr
- 336 Delaware St
- 1040 Rosewood Dr
- 1317 Brookdale Dr
- 1513 Amarillo Dr
- 1509 Amarillo Dr
- 1701 Queens Ct
- 1507 Amarillo Dr
- 1506 Amarillo Dr
- 1703 Queens Ct
- 1515 Amarillo Dr
- 1510 Amarillo Dr
- 1706 Queens Ct
- 1505 Amarillo Dr
- 1512 Amarillo Dr
- 1504 Amarillo Dr
- 1517 Amarillo Dr
- 1710 Queens Ct
- 1425 Kings Rd
- 1431 Kings Rd
- 1429 Kings Rd
- 1519 Amarillo Dr
- 1433 Kings Rd
- 1516 Amarillo Dr