1511 Autumn Chase Dr Fenton, MO 63026
Estimated Value: $484,330 - $538,000
3
Beds
4
Baths
2,355
Sq Ft
$214/Sq Ft
Est. Value
About This Home
This home is located at 1511 Autumn Chase Dr, Fenton, MO 63026 and is currently estimated at $504,333, approximately $214 per square foot. 1511 Autumn Chase Dr is a home located in St. Louis County with nearby schools including Kellison Elementary School, Rockwood South Middle School, and Rockwood Summit Senior High School.
Ownership History
Date
Name
Owned For
Owner Type
Purchase Details
Closed on
May 18, 2006
Sold by
Fritschle Sandra Ann
Bought by
Dedic Dennis Michael and Dedic Christina Marie
Current Estimated Value
Home Financials for this Owner
Home Financials are based on the most recent Mortgage that was taken out on this home.
Original Mortgage
$278,300
Outstanding Balance
$161,180
Interest Rate
6.4%
Mortgage Type
Fannie Mae Freddie Mac
Estimated Equity
$343,153
Purchase Details
Closed on
Dec 27, 2002
Sold by
Fritschle Sandra Ann
Bought by
Fritschle Sandra Ann
Purchase Details
Closed on
Mar 8, 1999
Sold by
Fritschle Sandra Ann
Bought by
Fritschle Reva D
Home Financials for this Owner
Home Financials are based on the most recent Mortgage that was taken out on this home.
Original Mortgage
$158,000
Interest Rate
6.73%
Create a Home Valuation Report for This Property
The Home Valuation Report is an in-depth analysis detailing your home's value as well as a comparison with similar homes in the area
Home Values in the Area
Average Home Value in this Area
Purchase History
| Date | Buyer | Sale Price | Title Company |
|---|---|---|---|
| Dedic Dennis Michael | $299,500 | None Available | |
| Fritschle Sandra Ann | -- | -- | |
| Fritschle Reva D | -- | -- | |
| Fritschle Sandra Ann | $197,500 | -- | |
| Sherman William A C | -- | -- |
Source: Public Records
Mortgage History
| Date | Status | Borrower | Loan Amount |
|---|---|---|---|
| Open | Dedic Dennis Michael | $278,300 | |
| Previous Owner | Fritschle Sandra Ann | $158,000 |
Source: Public Records
Tax History Compared to Growth
Tax History
| Year | Tax Paid | Tax Assessment Tax Assessment Total Assessment is a certain percentage of the fair market value that is determined by local assessors to be the total taxable value of land and additions on the property. | Land | Improvement |
|---|---|---|---|---|
| 2025 | $5,680 | $83,340 | $25,120 | $58,220 |
| 2024 | $5,680 | $76,310 | $14,140 | $62,170 |
| 2023 | $5,675 | $76,310 | $14,140 | $62,170 |
| 2022 | $4,954 | $62,040 | $13,490 | $48,550 |
| 2021 | $4,916 | $62,040 | $13,490 | $48,550 |
| 2020 | $4,702 | $57,040 | $12,010 | $45,030 |
| 2019 | $4,716 | $57,040 | $12,010 | $45,030 |
| 2018 | $4,790 | $55,600 | $10,490 | $45,110 |
| 2017 | $4,751 | $55,600 | $10,490 | $45,110 |
| 2016 | $4,426 | $52,290 | $10,490 | $41,800 |
| 2015 | $4,335 | $52,290 | $10,490 | $41,800 |
| 2014 | $4,251 | $49,990 | $8,270 | $41,720 |
Source: Public Records
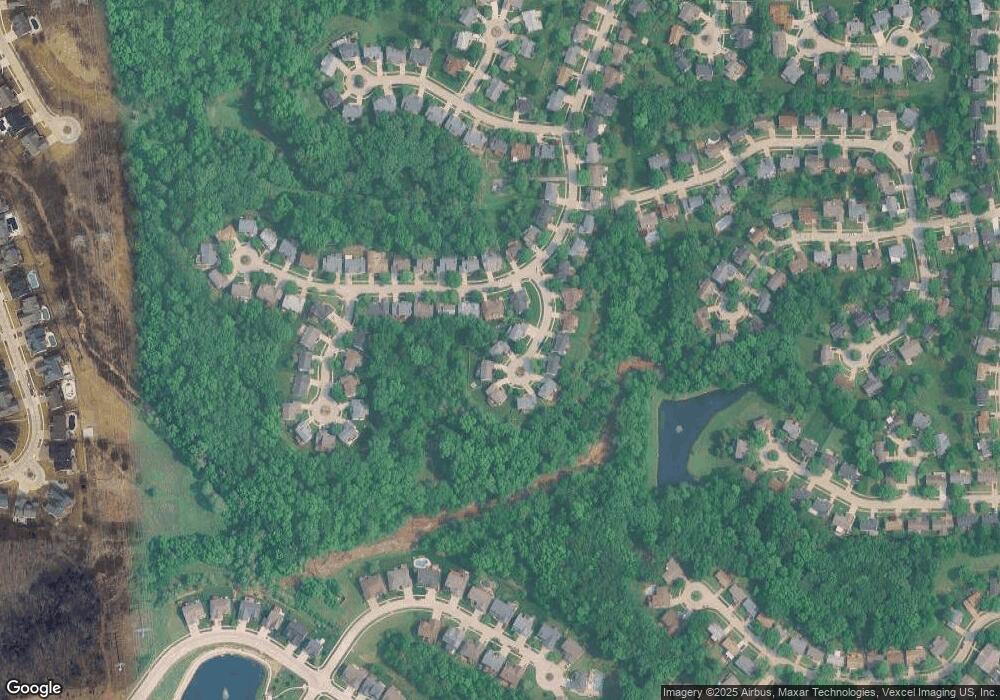
Map
Nearby Homes
- 1443 Summerpoint Ln
- 1405 Durango Ln Unit 3
- 1318 Summers End Dr
- 1221 Newport Landing Dr
- 1564 Codorniz Ln
- 1185 Scheel Ln
- 1201 Diamond Valley Dr
- 1222 Perdiz Ln
- 1273 Pequeno Ln
- 1050 Little Brennen Ct
- 1362 Hillsboro Rd
- 1305 Trails Dr
- 1524 Shalimar Ridge Ln
- 944 San Luis Dr
- 1800 Harbor Mill Dr
- 1881 San Pedro Ln
- 1966 San Luis Rey Pkwy
- 1883 San Lucas Ln
- 1406 Hawkins Meadow Dr
- 457 Avalon View Ct
- 1503 Autumn Chase Dr
- 1519 Autumn Chase Dr
- 1430 Summerpoint Ln
- 1434 Summerpoint Ln
- 1500 Autumn Chase Dr
- 1531 Autumn Chase Dr
- 1438 Summerpoint Ln
- 1518 Autumn Chase Dr
- 1506 Autumn Chase Dr
- 1524 Autumn Chase Dr
- 1512 Autumn Chase Dr
- 1442 Summerpoint Ln
- 1530 Autumn Chase Dr
- 1427 Summerpoint Ln
- 1431 Summerpoint Ln
- 1536 Autumn Chase Dr
- 1446 Summerpoint Ln
- 1423 Summerpoint Ln
- 1435 Summerpoint Ln
- 1542 Autumn Chase Dr