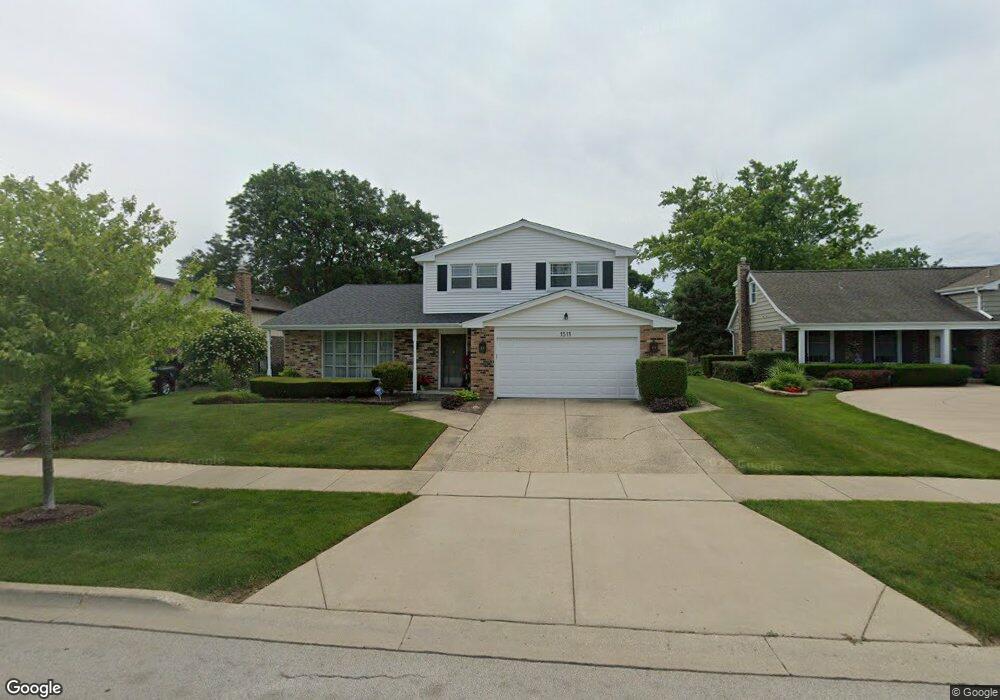
1511 E Suffield Dr Arlington Heights, IL 60004
Ivy Hill NeighborhoodEstimated Value: $560,000 - $728,000
4
Beds
3
Baths
1,971
Sq Ft
$312/Sq Ft
Est. Value
About This Home
This home is located at 1511 E Suffield Dr, Arlington Heights, IL 60004 and is currently estimated at $615,031, approximately $312 per square foot. 1511 E Suffield Dr is a home located in Cook County with nearby schools including Dwight D Eisenhower Elementary School, Bonfield Grade School, and Anne Sullivan Elementary School.
Ownership History
Date
Name
Owned For
Owner Type
Purchase Details
Closed on
May 12, 2025
Sold by
Brandon Erik J and Brandon Elizabeth A
Bought by
Elizabeth A Brandon And Erik J Brandon Living and Brandon
Current Estimated Value
Purchase Details
Closed on
Jun 20, 2002
Sold by
Wright Darin and Wright Jeannine
Bought by
Brandon Erik J and Brandon Elizabeth A
Home Financials for this Owner
Home Financials are based on the most recent Mortgage that was taken out on this home.
Original Mortgage
$269,200
Interest Rate
6.87%
Purchase Details
Closed on
May 28, 1996
Sold by
Silverston David and Silverston Pamela Guidice
Bought by
Wright Darin and Wright Jeannine
Home Financials for this Owner
Home Financials are based on the most recent Mortgage that was taken out on this home.
Original Mortgage
$206,100
Interest Rate
7.99%
Create a Home Valuation Report for This Property
The Home Valuation Report is an in-depth analysis detailing your home's value as well as a comparison with similar homes in the area
Home Values in the Area
Average Home Value in this Area
Purchase History
| Date | Buyer | Sale Price | Title Company |
|---|---|---|---|
| Elizabeth A Brandon And Erik J Brandon Living | -- | None Listed On Document | |
| Brandon Erik J | $336,500 | -- | |
| Wright Darin | $229,000 | -- |
Source: Public Records
Mortgage History
| Date | Status | Borrower | Loan Amount |
|---|---|---|---|
| Previous Owner | Brandon Erik J | $269,200 | |
| Previous Owner | Wright Darin | $206,100 |
Source: Public Records
Tax History Compared to Growth
Tax History
| Year | Tax Paid | Tax Assessment Tax Assessment Total Assessment is a certain percentage of the fair market value that is determined by local assessors to be the total taxable value of land and additions on the property. | Land | Improvement |
|---|---|---|---|---|
| 2025 | $9,207 | $49,000 | $10,800 | $38,200 |
| 2024 | $9,207 | $37,000 | $9,900 | $27,100 |
| 2023 | $8,764 | $37,000 | $9,900 | $27,100 |
| 2022 | $8,764 | $37,000 | $9,900 | $27,100 |
| 2021 | $8,938 | $32,736 | $5,625 | $27,111 |
| 2020 | $8,768 | $32,736 | $5,625 | $27,111 |
| 2019 | $8,745 | $36,496 | $5,625 | $30,871 |
| 2018 | $10,727 | $40,276 | $4,950 | $35,326 |
| 2017 | $10,632 | $40,276 | $4,950 | $35,326 |
| 2016 | $10,140 | $40,276 | $4,950 | $35,326 |
| 2015 | $9,367 | $34,142 | $4,275 | $29,867 |
| 2014 | $9,260 | $34,142 | $4,275 | $29,867 |
| 2013 | $9,035 | $34,142 | $4,275 | $29,867 |
Source: Public Records
Map
Nearby Homes
- 2632 N Windsor Dr Unit 104
- 2612 N Windsor Dr Unit 201
- 2643 N Prindle Ave
- 2407 N Hickory Ln
- 1030 Cottonwood Ct Unit 2A
- 1025 Cottonwood Ct Unit 2AR
- 1507 Clearwater Ln Unit 1
- 1014 Lakeland Ct Unit 2A
- 791 Lakeside Circle Dr Unit 1
- 671 Cedarwood Ct Unit 2
- 691 Lakeside Circle Dr
- 528 Surf Ct
- 711 E Hackberry Dr
- 2812 Jackson Dr
- 1637 Tahoe Circle Dr Unit 209
- 413 Buffalo Trail Unit 10601
- 1522 E Fleming Dr N
- 2002 N Eastwood Dr
- 2315 N Arlington Heights Rd
- 214 E Ivy Ln
- 1517 E Suffield Dr
- 1507 E Suffield Dr
- 1512 E Waverly Dr
- 1508 E Waverly Dr
- 1523 E Suffield Dr
- 1503 E Suffield Dr
- 1516 E Waverly Dr
- 1504 E Waverly Dr
- 1520 E Waverly Dr
- 1603 E Suffield Dr
- 1417 E Suffield Dr
- 1607 E Suffield Dr
- 1411 E Suffield Dr
- 1414 E Waverly Dr
- 1608 E Waverly Dr
- 1509 E Waverly Dr
- 2439 N Drury Ln
- 1519 E Waverly Dr
- 2601 N Wilshire Ln
- 1611 E Suffield Dr