Estimated Value: $720,000 - $837,000
4
Beds
3
Baths
3,833
Sq Ft
$206/Sq Ft
Est. Value
About This Home
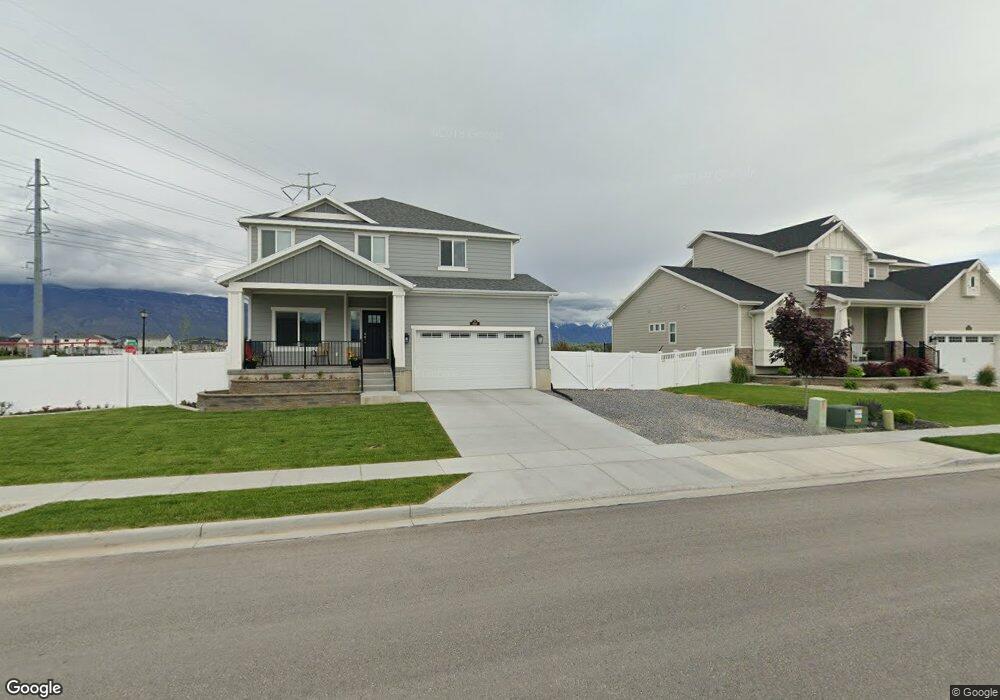
This home is located at 1511 S 50 W, Lehi, UT 84043 and is currently estimated at $789,411, approximately $205 per square foot. 1511 S 50 W is a home located in Utah County with nearby schools including Dry Creek Elementary School, Lehi Junior High School, and Lehi High School.
Ownership History
Date
Name
Owned For
Owner Type
Purchase Details
Closed on
Nov 13, 2024
Sold by
Dunford Leanne
Bought by
Leanne Dunford Family Trust and Dunford
Current Estimated Value
Purchase Details
Closed on
Oct 23, 2023
Sold by
Dunford Leanne
Bought by
Leanne Dunford Family Trust and Dunford
Purchase Details
Closed on
Sep 15, 2021
Sold by
Dunford Chad
Bought by
Dunford Leanne
Home Financials for this Owner
Home Financials are based on the most recent Mortgage that was taken out on this home.
Original Mortgage
$548,000
Interest Rate
2.7%
Mortgage Type
New Conventional
Purchase Details
Closed on
Mar 8, 2017
Sold by
Oakwood Homes Of Utah Llc
Bought by
Dunford Chad and Dunford Leanne
Home Financials for this Owner
Home Financials are based on the most recent Mortgage that was taken out on this home.
Original Mortgage
$274,031
Interest Rate
4.19%
Mortgage Type
New Conventional
Create a Home Valuation Report for This Property
The Home Valuation Report is an in-depth analysis detailing your home's value as well as a comparison with similar homes in the area
Home Values in the Area
Average Home Value in this Area
Purchase History
| Date | Buyer | Sale Price | Title Company |
|---|---|---|---|
| Leanne Dunford Family Trust | -- | None Listed On Document | |
| Leanne Dunford Family Trust | -- | None Listed On Document | |
| Dunford Leanne | -- | Eagle Pointe Title Ins Agcy | |
| Dunford Chad | -- | Bartlett Title Ins Agen |
Source: Public Records
Mortgage History
| Date | Status | Borrower | Loan Amount |
|---|---|---|---|
| Previous Owner | Dunford Leanne | $548,000 | |
| Previous Owner | Dunford Chad | $274,031 |
Source: Public Records
Tax History Compared to Growth
Tax History
| Year | Tax Paid | Tax Assessment Tax Assessment Total Assessment is a certain percentage of the fair market value that is determined by local assessors to be the total taxable value of land and additions on the property. | Land | Improvement |
|---|---|---|---|---|
| 2025 | $3,292 | $414,260 | $267,800 | $485,400 |
| 2024 | $3,292 | $385,275 | $0 | $0 |
| 2023 | $3,111 | $395,285 | $0 | $0 |
| 2022 | $3,267 | $402,490 | $0 | $0 |
| 2021 | $2,712 | $505,100 | $155,000 | $350,100 |
| 2020 | $2,557 | $470,700 | $143,500 | $327,200 |
| 2019 | $2,237 | $428,000 | $143,500 | $284,500 |
| 2018 | $2,141 | $387,400 | $140,000 | $247,400 |
| 2017 | $1,009 | $97,075 | $0 | $0 |
| 2016 | $1,334 | $119,000 | $0 | $0 |
| 2015 | $1,240 | $105,000 | $0 | $0 |
Source: Public Records
Map
Nearby Homes
- Adagio Plan at Grandeur Estates
- Ballad Plan at Grandeur Estates
- Interlude Plan at Grandeur Estates
- Trio Plan at Grandeur Estates
- Forte Plan at Grandeur Estates
- Tenor Plan at Grandeur Estates
- Staccato Plan at Grandeur Estates
- Prelude Plan at Grandeur Estates
- Octave Plan at Grandeur Estates
- Finale Plan at Grandeur Estates
- Harrison Plan at Grandeur Estates
- Crescendo Plan at Grandeur Estates
- Timpani Plan at Grandeur Estates
- Harvard Plan at Grandeur Estates
- Treble Plan at Grandeur Estates
- Browning Plan at Grandeur Estates
- Accord Plan at Grandeur Estates
- Tempo Plan at Grandeur Estates
- Bravo Plan at Grandeur Estates
- Canon Plan at Grandeur Estates