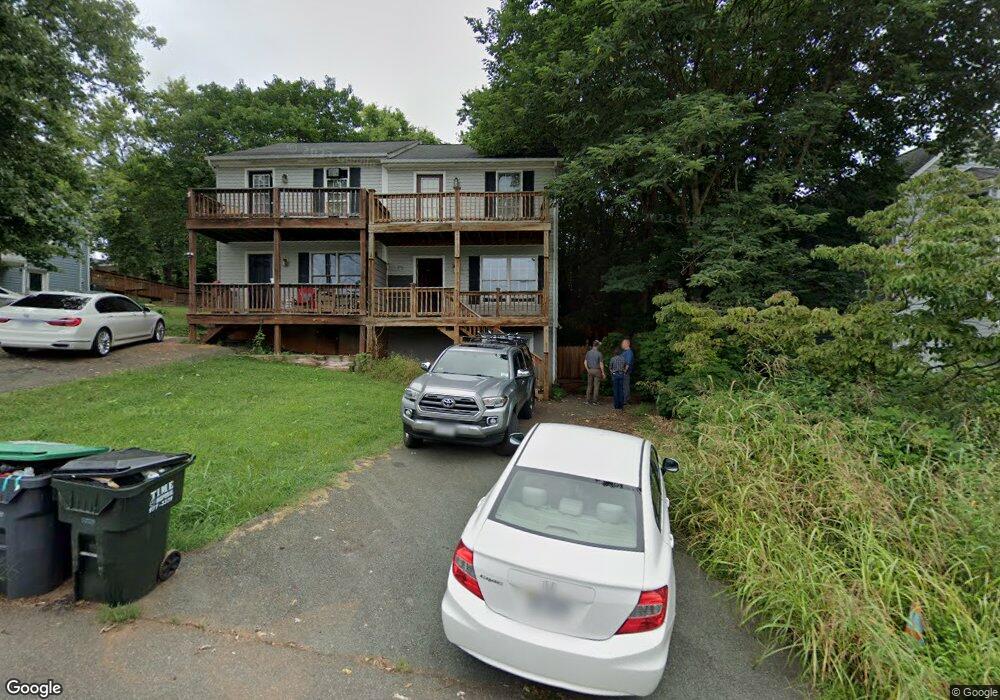
1511 Vine St Charlottesville, VA 22902
Belmont NeighborhoodEstimated Value: $295,000 - $348,000
3
Beds
3
Baths
1,292
Sq Ft
$258/Sq Ft
Est. Value
About This Home
This home is located at 1511 Vine St, Charlottesville, VA 22902 and is currently estimated at $333,291, approximately $257 per square foot. 1511 Vine St is a home located in Charlottesville City with nearby schools including Summit Elementary School, Buford Middle School, and Charlottesville High School.
Ownership History
Date
Name
Owned For
Owner Type
Purchase Details
Closed on
Sep 14, 2023
Sold by
Searcy Travis Shane
Bought by
May William P and May Erica
Current Estimated Value
Home Financials for this Owner
Home Financials are based on the most recent Mortgage that was taken out on this home.
Original Mortgage
$175,000
Outstanding Balance
$171,439
Interest Rate
7.18%
Estimated Equity
$161,852
Purchase Details
Closed on
Apr 18, 2006
Bought by
Searcy Travis Shane
Create a Home Valuation Report for This Property
The Home Valuation Report is an in-depth analysis detailing your home's value as well as a comparison with similar homes in the area
Home Values in the Area
Average Home Value in this Area
Purchase History
| Date | Buyer | Sale Price | Title Company |
|---|---|---|---|
| May William P | $250,000 | Old Republic National Title In | |
| Searcy Travis Shane | $213,000 | -- |
Source: Public Records
Mortgage History
| Date | Status | Borrower | Loan Amount |
|---|---|---|---|
| Open | May William P | $175,000 |
Source: Public Records
Tax History
| Year | Tax Paid | Tax Assessment Tax Assessment Total Assessment is a certain percentage of the fair market value that is determined by local assessors to be the total taxable value of land and additions on the property. | Land | Improvement |
|---|---|---|---|---|
| 2025 | $3,290 | $331,300 | $73,100 | $258,200 |
| 2024 | $3,290 | $328,700 | $73,100 | $255,600 |
| 2023 | $3,245 | $333,500 | $85,100 | $248,400 |
| 2022 | $2,575 | $263,700 | $68,000 | $195,700 |
| 2021 | $2,280 | $235,500 | $60,800 | $174,700 |
| 2020 | $2,203 | $227,300 | $47,600 | $179,700 |
| 2019 | $2,203 | $227,300 | $47,600 | $179,700 |
| 2018 | $1,022 | $210,600 | $44,100 | $166,500 |
| 2017 | $1,863 | $191,584 | $40,100 | $151,484 |
| 2016 | $1,764 | $180,100 | $35,800 | $144,300 |
| 2015 | $1,764 | $180,100 | $35,800 | $144,300 |
| 2014 | $1,764 | $180,100 | $35,800 | $144,300 |
Source: Public Records
Map
Nearby Homes
- 1429 Midland St
- 152 Junction Ln
- 316 Carlton Rd
- 117 Hartford Ct
- 118 Hartford Ct
- 943 Rives St
- 1108 Blenheim Ave
- 975 Rives St
- 1107 Myrtle St
- 706 Castalia St
- 307 Spruce St
- 1007 Montrose Ave
- 1016 Elliott Ave
- 2004 Pireus Row
- 1012 Altavista Ave
- 1915 E Market St Unit 3
- 908 Elliott Ave
- 202 Douglas Ave Unit 3D
- TBD Montrose Ave
- 919 Druid Ave
Your Personal Tour Guide
Ask me questions while you tour the home.