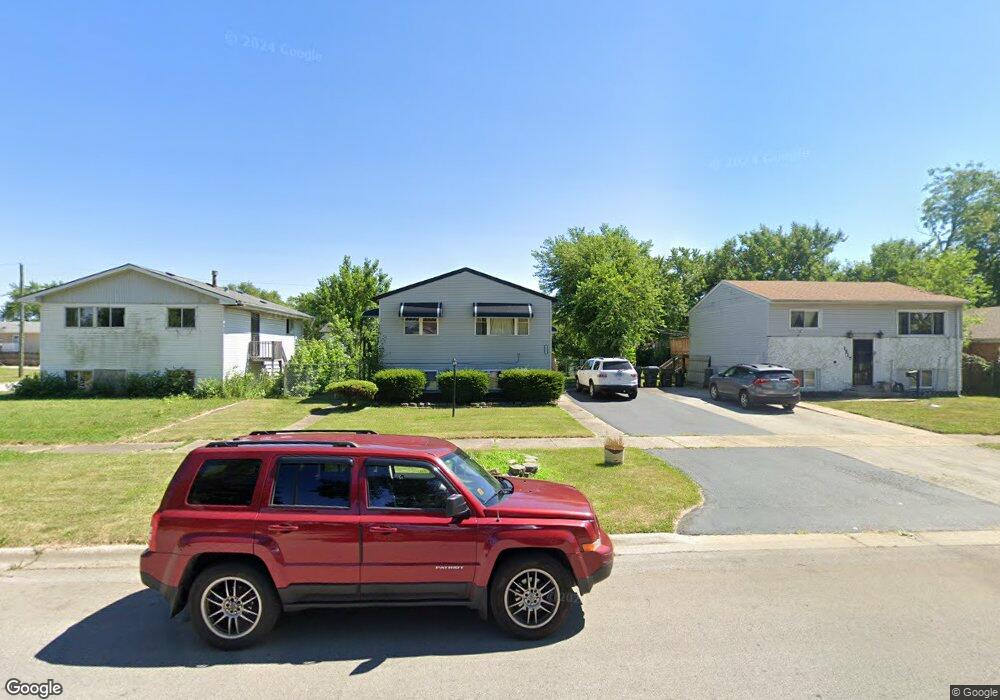
1511 W 163rd St Markham, IL 60428
Estimated Value: $119,000 - $216,000
5
Beds
2
Baths
780
Sq Ft
$198/Sq Ft
Est. Value
About This Home
This home is located at 1511 W 163rd St, Markham, IL 60428 and is currently estimated at $154,106, approximately $197 per square foot. 1511 W 163rd St is a home located in Cook County with nearby schools including Thornwood High School.
Ownership History
Date
Name
Owned For
Owner Type
Purchase Details
Closed on
Jan 5, 2015
Sold by
Trimuel Michael
Bought by
Trim S Investment Llc
Current Estimated Value
Purchase Details
Closed on
Jun 30, 2009
Sold by
Hsbc Bank Usa National Association
Bought by
Trimuel Michael
Purchase Details
Closed on
Dec 18, 2008
Sold by
Lee Allen
Bought by
Hsbc Bank Usa National Association
Purchase Details
Closed on
Feb 11, 2005
Sold by
Dewberry John H
Bought by
Lee Allen
Home Financials for this Owner
Home Financials are based on the most recent Mortgage that was taken out on this home.
Original Mortgage
$89,250
Interest Rate
7.7%
Mortgage Type
Unknown
Purchase Details
Closed on
Apr 26, 2001
Sold by
Johnson Verliler
Bought by
Dewberry John H
Home Financials for this Owner
Home Financials are based on the most recent Mortgage that was taken out on this home.
Original Mortgage
$71,725
Interest Rate
10.3%
Create a Home Valuation Report for This Property
The Home Valuation Report is an in-depth analysis detailing your home's value as well as a comparison with similar homes in the area
Home Values in the Area
Average Home Value in this Area
Purchase History
| Date | Buyer | Sale Price | Title Company |
|---|---|---|---|
| Trim S Investment Llc | -- | None Available | |
| Trimuel Michael | $24,500 | First American Title | |
| Hsbc Bank Usa National Association | -- | None Available | |
| Lee Allen | $105,000 | Git | |
| Dewberry John H | $75,500 | Stewart Title |
Source: Public Records
Mortgage History
| Date | Status | Borrower | Loan Amount |
|---|---|---|---|
| Previous Owner | Lee Allen | $89,250 | |
| Previous Owner | Dewberry John H | $71,725 | |
| Closed | Lee Allen | $10,500 |
Source: Public Records
Tax History Compared to Growth
Tax History
| Year | Tax Paid | Tax Assessment Tax Assessment Total Assessment is a certain percentage of the fair market value that is determined by local assessors to be the total taxable value of land and additions on the property. | Land | Improvement |
|---|---|---|---|---|
| 2024 | $4,165 | $5,900 | $1,984 | $3,916 |
| 2023 | $4,248 | $5,900 | $1,984 | $3,916 |
| 2022 | $4,248 | $4,481 | $1,679 | $2,802 |
| 2021 | $4,146 | $4,480 | $1,678 | $2,802 |
| 2020 | $3,989 | $4,480 | $1,678 | $2,802 |
| 2019 | $4,334 | $5,097 | $1,526 | $3,571 |
| 2018 | $4,210 | $5,097 | $1,526 | $3,571 |
| 2017 | $4,107 | $5,097 | $1,526 | $3,571 |
| 2016 | $4,031 | $5,202 | $1,373 | $3,829 |
| 2015 | $3,776 | $5,202 | $1,373 | $3,829 |
| 2014 | $4,572 | $6,241 | $1,373 | $4,868 |
| 2013 | $4,634 | $6,751 | $1,373 | $5,378 |
Source: Public Records
Map
Nearby Homes
- 16306 Park Ave
- 16423 Marshfield Ave
- 1716 W 163rd St
- 16329 Hermitage Ave
- 16510 Marshfield Ave
- 16527 Marshfield Ave
- 16019 Myrtle Ave
- 16037 Marshfield Ave
- 16547 Paulina St
- 16611 Marshfield Ave
- 16154 Wood St
- 16619 Marshfield Ave
- 16049 Wood St
- 1848 W 163rd St
- 15929 Marshfield Ave
- 16154 Honore Ave
- 16637 Paulina St
- 16450 Honore Ave
- 16460 Honore Ave
- 69 E 159th St
- 1517 W 163rd St
- 1507 W 163rd St
- 16318 Laflin Ave
- 1523 W 163rd St
- 16322 Laflin Ave
- 16319 Justine St
- 16319 Justine St
- 16258 Laflin Ave
- 16305 Justine St
- 1459 W 163rd St
- 16325 Justine St
- 16328 Laflin Ave
- 16254 Laflin Ave
- 16259 Justine St
- 16317 Laflin Ave
- 1453 W 163rd St
- 16329 Justine St
- 16321 Laflin Ave
- 16253 Justine St
- 16259 Laflin Ave