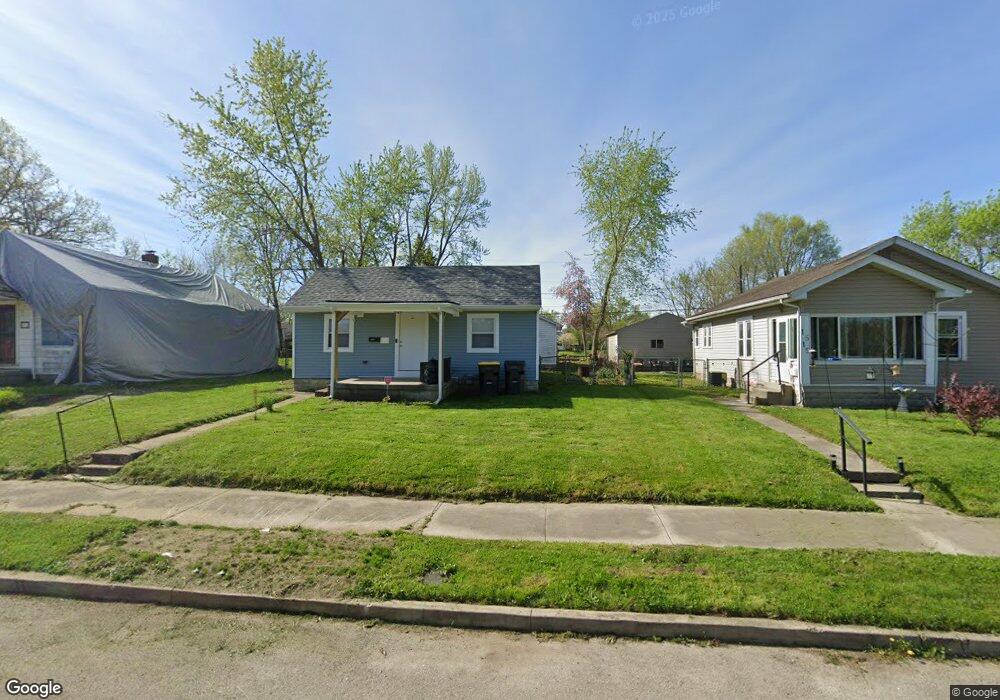
1511 W 2nd St Anderson, IN 46016
Estimated Value: $66,000 - $93,000
2
Beds
1
Bath
967
Sq Ft
$79/Sq Ft
Est. Value
About This Home
This home is located at 1511 W 2nd St, Anderson, IN 46016 and is currently estimated at $76,386, approximately $78 per square foot. 1511 W 2nd St is a home located in Madison County with nearby schools including Eastside Elementary School, Highland Middle School, and Anderson High School.
Ownership History
Date
Name
Owned For
Owner Type
Purchase Details
Closed on
Sep 20, 2023
Sold by
Chatman Jeffrey
Bought by
Ramirez Agustin
Current Estimated Value
Purchase Details
Closed on
Feb 28, 2019
Sold by
Madison County Auditor
Bought by
Chatman Jeffrey
Purchase Details
Closed on
Feb 16, 2018
Sold by
Rose David
Bought by
Herley Daniel
Purchase Details
Closed on
Dec 14, 2017
Sold by
Reo Logic Indiana Holdings Llc
Bought by
Rose David
Purchase Details
Closed on
Aug 5, 2015
Sold by
U S Bank
Bought by
Reo Logic Indiana Holdings Llc
Purchase Details
Closed on
May 7, 2015
Sold by
Madison County Auditor
Bought by
Us Bank
Create a Home Valuation Report for This Property
The Home Valuation Report is an in-depth analysis detailing your home's value as well as a comparison with similar homes in the area
Home Values in the Area
Average Home Value in this Area
Purchase History
| Date | Buyer | Sale Price | Title Company |
|---|---|---|---|
| Ramirez Agustin | -- | Fidelity National Title | |
| Chatman Jeffrey | $2,026 | None Available | |
| Herley Daniel | -- | -- | |
| Rose David | -- | -- | |
| Reo Logic Indiana Holdings Llc | -- | -- | |
| Us Bank | $1,704 | -- |
Source: Public Records
Tax History Compared to Growth
Tax History
| Year | Tax Paid | Tax Assessment Tax Assessment Total Assessment is a certain percentage of the fair market value that is determined by local assessors to be the total taxable value of land and additions on the property. | Land | Improvement |
|---|---|---|---|---|
| 2024 | $578 | $26,000 | $5,600 | $20,400 |
| 2023 | $532 | $23,800 | $5,300 | $18,500 |
| 2022 | $532 | $23,800 | $4,900 | $18,900 |
| 2021 | $493 | $21,900 | $4,900 | $17,000 |
| 2020 | $472 | $20,900 | $4,700 | $16,200 |
| 2019 | $1,123 | $20,400 | $4,700 | $15,700 |
| 2018 | $602 | $26,100 | $4,700 | $21,400 |
| 2017 | $518 | $25,900 | $4,700 | $21,200 |
| 2016 | $1,772 | $25,900 | $4,700 | $21,200 |
| 2014 | $708 | $35,400 | $5,000 | $30,400 |
| 2013 | $708 | $35,500 | $5,000 | $30,500 |
Source: Public Records
Map
Nearby Homes