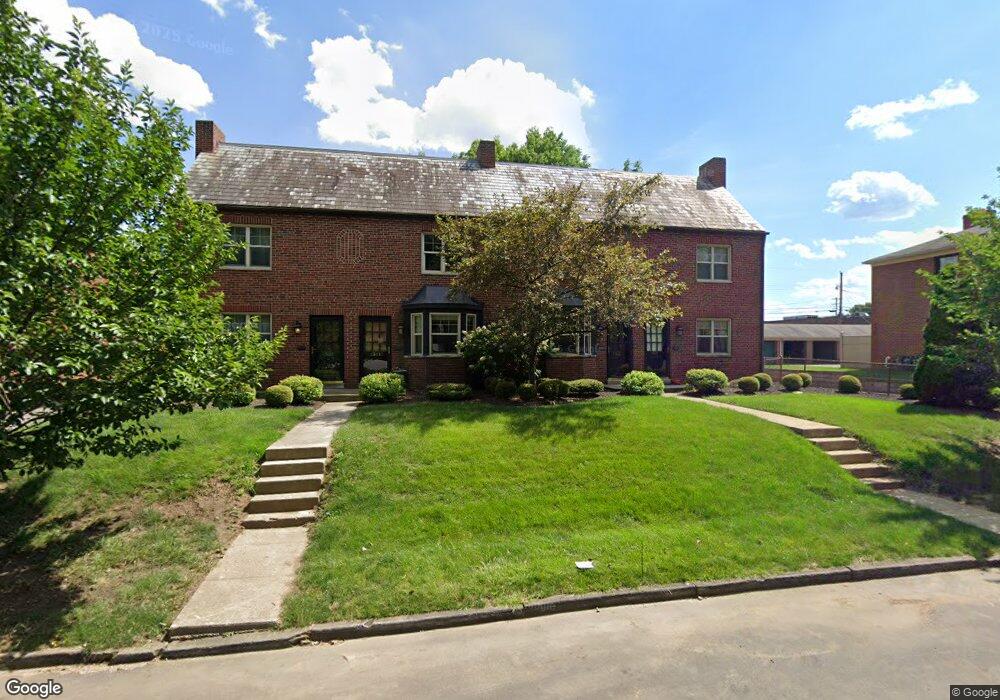
1511 W 6th Ave Unit TWENTY Columbus, OH 43212
Fifth by Northwest NeighborhoodEstimated Value: $136,000 - $201,940
2
Beds
1
Bath
1,188
Sq Ft
$151/Sq Ft
Est. Value
About This Home
This home is located at 1511 W 6th Ave Unit TWENTY, Columbus, OH 43212 and is currently estimated at $179,485, approximately $151 per square foot. 1511 W 6th Ave Unit TWENTY is a home located in Franklin County with nearby schools including Cranbrook Elementary School, Ridgeview Middle School, and Centennial High School.
Ownership History
Date
Name
Owned For
Owner Type
Purchase Details
Closed on
May 16, 2022
Sold by
Rowe Foundation Llc
Bought by
Daffeh Fatoumatta
Current Estimated Value
Home Financials for this Owner
Home Financials are based on the most recent Mortgage that was taken out on this home.
Original Mortgage
$179,450
Outstanding Balance
$170,550
Interest Rate
5.3%
Mortgage Type
New Conventional
Estimated Equity
$8,935
Purchase Details
Closed on
Nov 1, 2019
Sold by
Total Resource Constractors Llc
Bought by
Row Foundation Llc
Purchase Details
Closed on
Oct 10, 2019
Sold by
Sandrock Dave
Bought by
Total Resource Contractor Llc
Purchase Details
Closed on
Dec 13, 2017
Sold by
Vazirani Sherry S and Vazirani Umesh
Bought by
Sandrock Dave
Purchase Details
Closed on
May 19, 2002
Sold by
Pack Richard N
Bought by
Vazirani Sherry S
Purchase Details
Closed on
Jun 30, 1997
Sold by
Estate Of Olivia M Pack
Bought by
Pack Richard N
Create a Home Valuation Report for This Property
The Home Valuation Report is an in-depth analysis detailing your home's value as well as a comparison with similar homes in the area
Home Values in the Area
Average Home Value in this Area
Purchase History
| Date | Buyer | Sale Price | Title Company |
|---|---|---|---|
| Daffeh Fatoumatta | $185,000 | World Class Title | |
| Row Foundation Llc | $15,500 | Metropolis Title | |
| Total Resource Contractor Llc | $4,000 | Metropolis | |
| Sandrock Dave | $8,800 | None Available | |
| Vazirani Sherry S | $9,000 | -- | |
| Pack Richard N | -- | -- |
Source: Public Records
Mortgage History
| Date | Status | Borrower | Loan Amount |
|---|---|---|---|
| Open | Daffeh Fatoumatta | $179,450 |
Source: Public Records
Tax History Compared to Growth
Tax History
| Year | Tax Paid | Tax Assessment Tax Assessment Total Assessment is a certain percentage of the fair market value that is determined by local assessors to be the total taxable value of land and additions on the property. | Land | Improvement |
|---|---|---|---|---|
| 2024 | $1,772 | $39,480 | $5,320 | $34,160 |
| 2023 | $1,749 | $39,480 | $5,320 | $34,160 |
| 2022 | $1,283 | $20,730 | $2,210 | $18,520 |
| 2021 | $1,231 | $20,730 | $2,210 | $18,520 |
| 2020 | $981 | $5,400 | $2,210 | $3,190 |
| 2019 | $1,460 | $3,090 | $1,860 | $1,230 |
| 2018 | $387 | $3,090 | $1,860 | $1,230 |
| 2017 | $1,299 | $3,090 | $1,860 | $1,230 |
| 2016 | $376 | $5,540 | $2,210 | $3,330 |
| 2015 | $426 | $5,540 | $2,210 | $3,330 |
| 2014 | $344 | $5,540 | $2,210 | $3,330 |
| 2013 | $187 | $6,125 | $2,450 | $3,675 |
Source: Public Records
Map
Nearby Homes
- 1655-1657 Ashland Ave
- 1661 Ashland Ave Unit 663
- 1364 W 7th Ave
- 00 W 7th Ave
- 1733 Elmwood Ave
- 1459 Elmwood Ave Unit 1459
- 1475 W 3rd Ave Unit 204
- 1561 Glenn Ave
- 1398 Lower Green Cir Unit 1398
- 1782 Wyandotte Rd
- 1126 King Ave Unit 128
- 1297 Doten Ave
- 1313 Lincoln Rd
- 1225 Eastview Ave
- 2015 W 5th Ave Unit 211
- 2015 W 5th Ave Unit 102
- 2015 W 5th Ave Unit 108
- 1095 W 3rd Ave
- 1093 W 3rd Ave
- 1242 Oxley Rd
- 1511 W 6th Ave Unit 1511
- 1511 W 6th Ave
- 1509 W 6th Ave Unit 1509
- 1509 W 6th Ave Unit TWENTY
- 1509 W 6th Ave Unit 1513
- 1509 W 6th Ave
- 1555 W 6th Ave Unit 557
- 1515 W 6th Ave Unit 1515
- 1541 W 6th Ave Unit TWENTY
- 1537 W 6th Ave Unit TWENTY
- 1533 W 6th Ave Unit TWENTY
- 1505 W 6th Ave Unit 507
- 1500 W 6th Ave Unit 502
- 1499 W 6th Ave
- 1527 W 6th Ave Unit TWENTY
- 1523 W 6th Ave Unit TWENTY
- 1519 W 6th Ave Unit TWENTY
- 1550 W 6th Ave Unit TWENTY
- 1546 W 6th Ave Unit TWENTY
- 1556 W 6th Ave Unit TWENTY