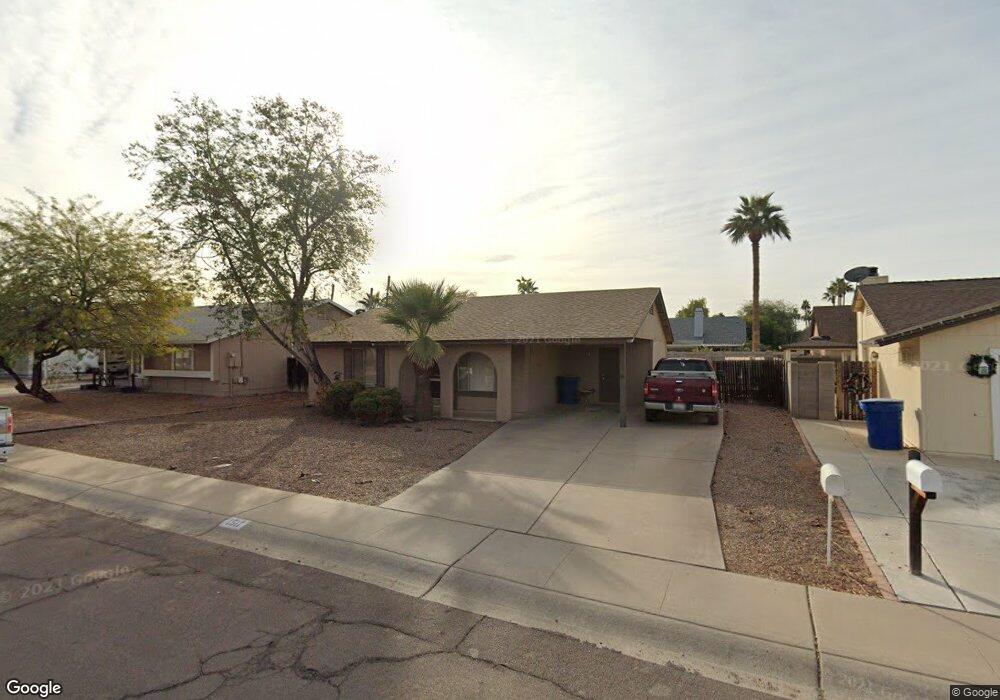
1511 W Cheyenne Dr Unit NICE Chandler, AZ 85224
Amberwood NeighborhoodEstimated Value: $364,279 - $385,000
2
Beds
2
Baths
1,106
Sq Ft
$340/Sq Ft
Est. Value
About This Home
This home is located at 1511 W Cheyenne Dr Unit NICE, Chandler, AZ 85224 and is currently estimated at $375,570, approximately $339 per square foot. 1511 W Cheyenne Dr Unit NICE is a home located in Maricopa County with nearby schools including Pomeroy Elementary School, Franklin at Brimhall Elementary School, and Summit Academy Elementary.
Ownership History
Date
Name
Owned For
Owner Type
Purchase Details
Closed on
Dec 30, 2024
Sold by
S And J Revocable Trust and Daumke James W
Bought by
Hannan Lillian Mary
Current Estimated Value
Purchase Details
Closed on
Jun 11, 2003
Sold by
Daumke James W and Daumke Sandra H
Bought by
Daumke James W and Daumke Sandra H
Home Financials for this Owner
Home Financials are based on the most recent Mortgage that was taken out on this home.
Original Mortgage
$82,500
Interest Rate
5.53%
Mortgage Type
Purchase Money Mortgage
Purchase Details
Closed on
Jun 2, 2000
Sold by
Daumke James W and Daumke Sandra H
Bought by
Daumke James W and Daumke Sandra H
Purchase Details
Closed on
Mar 17, 1999
Sold by
Daumke James W and Daumke Sandra H
Bought by
Daumke James W and Daumke Sandra H
Create a Home Valuation Report for This Property
The Home Valuation Report is an in-depth analysis detailing your home's value as well as a comparison with similar homes in the area
Home Values in the Area
Average Home Value in this Area
Purchase History
| Date | Buyer | Sale Price | Title Company |
|---|---|---|---|
| Hannan Lillian Mary | $375,000 | Navi Title Agency | |
| Hannan Lillian Mary | $375,000 | Navi Title Agency | |
| Daumke James W | -- | Security Title Agency | |
| Daumke James W | -- | Security Title Agency | |
| Daumke James W | -- | -- | |
| Daumke James W | -- | -- |
Source: Public Records
Mortgage History
| Date | Status | Borrower | Loan Amount |
|---|---|---|---|
| Previous Owner | Daumke James W | $82,500 |
Source: Public Records
Tax History Compared to Growth
Tax History
| Year | Tax Paid | Tax Assessment Tax Assessment Total Assessment is a certain percentage of the fair market value that is determined by local assessors to be the total taxable value of land and additions on the property. | Land | Improvement |
|---|---|---|---|---|
| 2025 | $1,028 | $12,060 | -- | -- |
| 2024 | $1,219 | $11,486 | -- | -- |
| 2023 | $1,219 | $28,150 | $5,630 | $22,520 |
| 2022 | $1,188 | $20,830 | $4,160 | $16,670 |
| 2021 | $1,181 | $18,670 | $3,730 | $14,940 |
| 2020 | $1,168 | $16,760 | $3,350 | $13,410 |
| 2019 | $1,086 | $15,170 | $3,030 | $12,140 |
| 2018 | $1,057 | $13,630 | $2,720 | $10,910 |
| 2017 | $1,019 | $12,450 | $2,490 | $9,960 |
| 2016 | $997 | $11,480 | $2,290 | $9,190 |
| 2015 | $935 | $10,260 | $2,050 | $8,210 |
Source: Public Records
Map
Nearby Homes
- 1309 W Marlboro Dr
- 1805 W Cheyenne Dr
- 1807 W Mission Dr
- 1821 W Mission Dr
- 1203 W Alamo Dr
- 1511 W Mesquite St
- 2615 N Yucca St
- 1224 W Mesquite St
- 1126 W Elliot Rd Unit 1040
- 1126 W Elliot Rd Unit 1010
- 2029 W Shawnee Dr
- 2609 N Pleasant Dr
- 2129 N Villas Ln
- 916 W Loughlin Dr
- 1800 W Rosewood Ct
- 2103 W Palomino Dr
- 2201 N Comanche Dr Unit 1080
- 2201 N Comanche Dr Unit 1104
- 2201 N Comanche Dr Unit 1018
- 2201 N Comanche Dr Unit 1002
- 1509 W Cheyenne Dr
- 1516 W Loughlin Dr
- 1518 W Loughlin Dr
- 1514 W Loughlin Dr
- 1517 W Cheyenne Dr
- 1507 W Cheyenne Dr
- 1510 W Cheyenne Dr
- 1512 W Cheyenne Dr
- 1520 W Loughlin Dr
- 1512 W Loughlin Dr
- 1508 W Cheyenne Dr
- 1514 W Cheyenne Dr
- 1519 W Cheyenne Dr
- 1522 W Loughlin Dr
- 1505 W Cheyenne Dr
- 1510 W Loughlin Dr
- 1516 W Cheyenne Dr
- 1506 W Cheyenne Dr
- 1523 W Loughlin Dr
- 1505 W Marlboro Dr