Estimated Value: $641,000 - $662,200
3
Beds
2
Baths
1,828
Sq Ft
$356/Sq Ft
Est. Value
About This Home
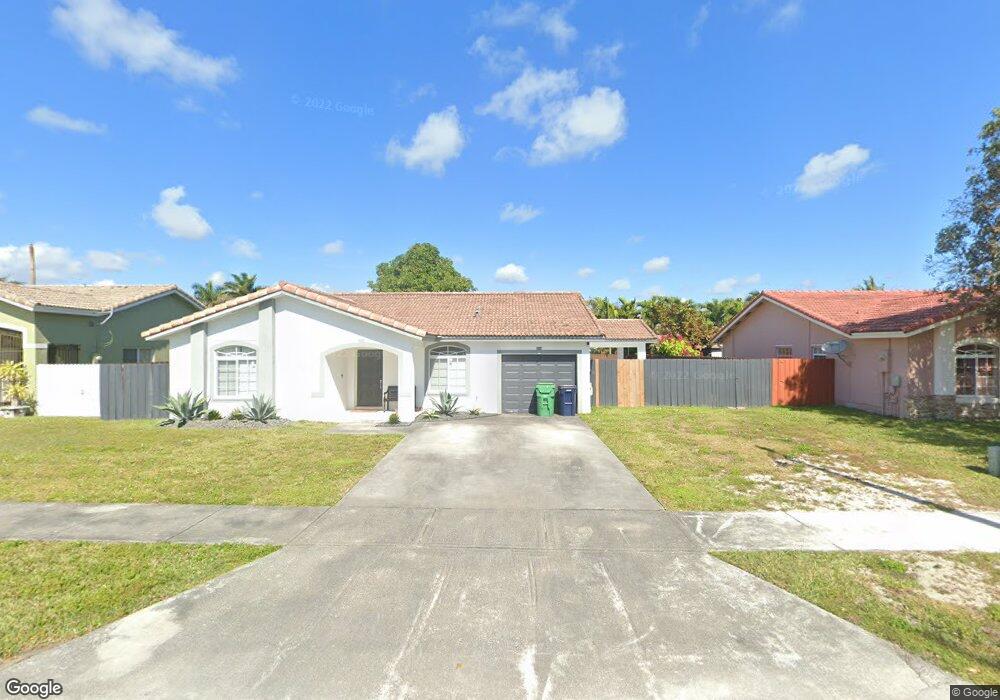
This home is located at 15113 SW 179th St, Miami, FL 33187 and is currently estimated at $650,300, approximately $355 per square foot. 15113 SW 179th St is a home located in Miami-Dade County with nearby schools including Jorge Mas Canosa Middle School, Arthur And Polly Mays Conservatory Of The Arts, and Robert Morgan Educational Center.
Ownership History
Date
Name
Owned For
Owner Type
Purchase Details
Closed on
Dec 2, 2022
Sold by
Camargo Miguel
Bought by
Moreno Jenny Camargo
Current Estimated Value
Home Financials for this Owner
Home Financials are based on the most recent Mortgage that was taken out on this home.
Original Mortgage
$205,000
Outstanding Balance
$198,848
Interest Rate
6.95%
Mortgage Type
New Conventional
Estimated Equity
$451,452
Purchase Details
Closed on
Jun 1, 2011
Sold by
Baro Christina M
Bought by
Figueroa Jenny and Camargo Miguel
Home Financials for this Owner
Home Financials are based on the most recent Mortgage that was taken out on this home.
Original Mortgage
$156,550
Interest Rate
4.79%
Mortgage Type
FHA
Purchase Details
Closed on
Nov 19, 1999
Sold by
Granada Home Builders Inc
Bought by
Baro Angel A and Baro Christina M
Create a Home Valuation Report for This Property
The Home Valuation Report is an in-depth analysis detailing your home's value as well as a comparison with similar homes in the area
Home Values in the Area
Average Home Value in this Area
Purchase History
| Date | Buyer | Sale Price | Title Company |
|---|---|---|---|
| Moreno Jenny Camargo | -- | Flamingo Title | |
| Figueroa Jenny | $169,000 | Attorney | |
| Figueroa Jenny | -- | Attorney | |
| Baro Angel A | $122,900 | -- |
Source: Public Records
Mortgage History
| Date | Status | Borrower | Loan Amount |
|---|---|---|---|
| Open | Moreno Jenny Camargo | $205,000 | |
| Previous Owner | Figueroa Jenny | $156,550 | |
| Previous Owner | Baro Angel A | $113,300 |
Source: Public Records
Tax History Compared to Growth
Tax History
| Year | Tax Paid | Tax Assessment Tax Assessment Total Assessment is a certain percentage of the fair market value that is determined by local assessors to be the total taxable value of land and additions on the property. | Land | Improvement |
|---|---|---|---|---|
| 2025 | $4,092 | $242,654 | -- | -- |
| 2024 | $3,871 | $235,816 | -- | -- |
| 2023 | $3,871 | $228,948 | $0 | $0 |
| 2022 | $3,021 | $181,562 | $0 | $0 |
| 2021 | $2,965 | $176,274 | $0 | $0 |
| 2020 | $2,932 | $173,841 | $0 | $0 |
| 2019 | $2,869 | $169,933 | $0 | $0 |
| 2018 | $2,721 | $166,765 | $0 | $0 |
| 2017 | $2,737 | $163,335 | $0 | $0 |
| 2016 | $2,658 | $159,976 | $0 | $0 |
| 2015 | $2,695 | $159,439 | $0 | $0 |
| 2014 | $2,733 | $158,174 | $0 | $0 |
Source: Public Records
Map
Nearby Homes
- 15105 SW 180th St
- 15012 SW 177th Terrace
- 17709 SW 150th Ct
- 15201 SW 177th Terrace
- 14952 SW 177th Terrace
- 18082 SW 152nd Ct
- 15266 SW 178th Terrace
- 17624 SW 149th Place
- 17606 SW 149th Place Unit 17606
- 15104 SW 176th St
- 15327 SW 179th Terrace
- 14859 SW 177th Terrace
- 18203 SW 152nd Place
- 18030 SW 153rd Ct
- 18003 SW 153rd Place
- 15340 SW 176th Ln
- 18110 SW 153rd Ct
- 14848 SW 181st Terrace
- 14824 SW 180th St
- 18253 SW 152nd Place
- 15053 SW 179th St
- 15123 SW 179th St
- 15110 SW 178th Terrace
- 15050 SW 178th Terrace
- 15120 SW 178th Terrace
- 15133 SW 179th St
- 15043 SW 179th St
- 17901 SW 151st Ct
- 15040 SW 178th Terrace
- 15130 SW 178th Terrace
- 17837 SW 151st Ave
- 17838 SW 151st Ave
- 15000 SW 179th St
- 17900 SW 151st Ct
- 15033 SW 179th St
- 15143 SW 179th St
- 17941 SW 151st Ct
- 15030 SW 178th Terrace
- 15140 SW 178th Terrace
- 17836 SW 150th Ct