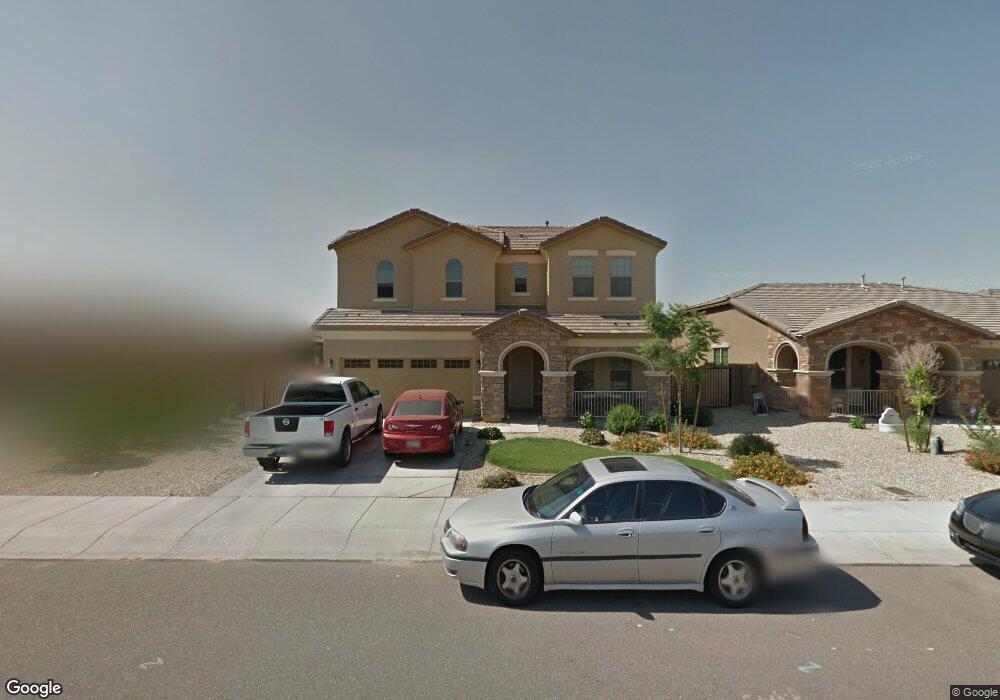
15113 W Turney Ave Goodyear, AZ 85395
Estimated Value: $490,000 - $627,000
4
Beds
3
Baths
2,417
Sq Ft
$219/Sq Ft
Est. Value
About This Home
This home is located at 15113 W Turney Ave, Goodyear, AZ 85395 and is currently estimated at $529,762, approximately $219 per square foot. 15113 W Turney Ave is a home located in Maricopa County with nearby schools including Mabel Padgett Elementary School, Western Sky Middle School, and Archway Classical Academy | Trivium.
Ownership History
Date
Name
Owned For
Owner Type
Purchase Details
Closed on
Jul 25, 2012
Sold by
Laing Johnathon and Whitney Ashley
Bought by
Laing Johnathon and Laing Ashley
Current Estimated Value
Home Financials for this Owner
Home Financials are based on the most recent Mortgage that was taken out on this home.
Original Mortgage
$213,955
Outstanding Balance
$148,774
Interest Rate
3.75%
Mortgage Type
FHA
Estimated Equity
$380,988
Purchase Details
Closed on
Sep 21, 2009
Sold by
Beazer Homes Sales Inc
Bought by
Laing Johnathon and Whitney Ashley
Home Financials for this Owner
Home Financials are based on the most recent Mortgage that was taken out on this home.
Original Mortgage
$217,955
Interest Rate
5.25%
Mortgage Type
FHA
Purchase Details
Closed on
May 11, 2006
Sold by
Hearthstone Multi Asset Entity A Lp
Bought by
Beazer Homes Holdings Corp
Create a Home Valuation Report for This Property
The Home Valuation Report is an in-depth analysis detailing your home's value as well as a comparison with similar homes in the area
Home Values in the Area
Average Home Value in this Area
Purchase History
| Date | Buyer | Sale Price | Title Company |
|---|---|---|---|
| Laing Johnathon | -- | None Available | |
| Laing Johnathon | $221,977 | Lawyers Title Of Arizona Inc | |
| Beazer Homes Sales Inc | -- | Lawyers Title Of Arizona Inc | |
| Beazer Homes Holdings Corp | $870,897 | None Available |
Source: Public Records
Mortgage History
| Date | Status | Borrower | Loan Amount |
|---|---|---|---|
| Open | Laing Johnathon | $213,955 | |
| Closed | Laing Johnathon | $217,955 |
Source: Public Records
Tax History Compared to Growth
Tax History
| Year | Tax Paid | Tax Assessment Tax Assessment Total Assessment is a certain percentage of the fair market value that is determined by local assessors to be the total taxable value of land and additions on the property. | Land | Improvement |
|---|---|---|---|---|
| 2025 | $2,833 | $25,022 | -- | -- |
| 2024 | $2,792 | $23,831 | -- | -- |
| 2023 | $2,792 | $35,980 | $7,190 | $28,790 |
| 2022 | $2,670 | $27,300 | $5,460 | $21,840 |
| 2021 | $2,753 | $26,370 | $5,270 | $21,100 |
| 2020 | $2,669 | $25,430 | $5,080 | $20,350 |
| 2019 | $2,592 | $23,970 | $4,790 | $19,180 |
| 2018 | $2,567 | $22,860 | $4,570 | $18,290 |
| 2017 | $2,445 | $21,670 | $4,330 | $17,340 |
| 2016 | $2,010 | $20,660 | $4,130 | $16,530 |
| 2015 | $2,345 | $18,760 | $3,750 | $15,010 |
Source: Public Records
Map
Nearby Homes
- 15105 W Glenrosa Ave
- 15152 W Westview Dr
- 15148 W Sells Dr
- 4485 N 152nd Dr
- 15265 W Montecito Ave
- 4481 N Luna Rd W
- 15028 W Minnezona Ave
- 4335 N 153rd Ln
- 4482 N 153rd Ln
- 15088 W Coolidge St
- 15194 W Vale Dr Unit 7
- 14849 W Aldea Ct
- 14870 W Aldea Cir
- 15296 W Coolidge St
- 3991 N 150th Ln
- 15270 W Amelia Dr
- 3928 N 151st Ave
- 15322 W Elm St
- 14852 W Aldea Dr N
- 934 W Elm St
- 15101 W Turney Ave
- 15125 W Turney Ave
- 15089 W Turney Ave
- 15137 W Turney Ave
- 15106 W Montecito Ave
- 15118 W Montecito Ave
- 15094 W Montecito Ave
- 15130 W Montecito Ave
- 15077 W Turney Ave
- 15149 W Turney Ave
- 15082 W Montecito Ave
- 15102 W Turney Ave
- 15126 W Turney Ave
- 15142 W Montecito Ave
- 15090 W Turney Ave
- 15070 W Montecito Ave
- 15065 W Turney Ave
- 15078 W Turney Ave
- 15154 W Montecito Ave
- 15058 W Montecito Ave