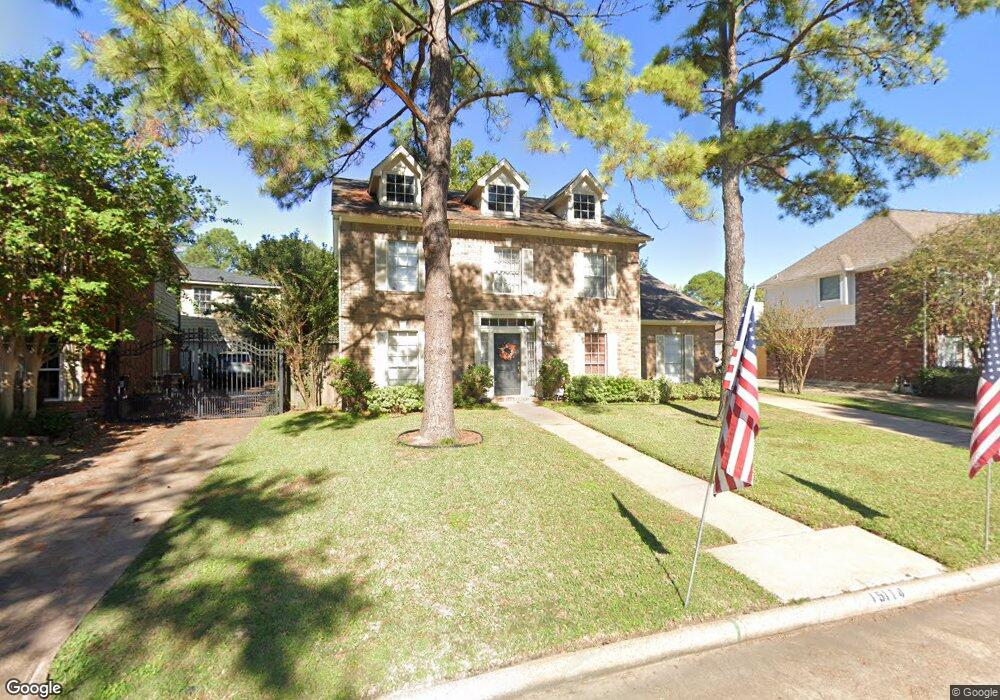
15114 Chetland Place Dr Houston, TX 77095
Copperfield NeighborhoodEstimated Value: $321,000 - $343,000
5
Beds
3
Baths
2,460
Sq Ft
$134/Sq Ft
Est. Value
About This Home
This home is located at 15114 Chetland Place Dr, Houston, TX 77095 and is currently estimated at $330,280, approximately $134 per square foot. 15114 Chetland Place Dr is a home located in Harris County with nearby schools including Owens Elementary School, Labay Middle School, and Cypress Falls High School.
Ownership History
Date
Name
Owned For
Owner Type
Purchase Details
Closed on
Nov 22, 1996
Sold by
Kent Paul Frederick
Bought by
Cairns Paul G and Cairns Kathryn A
Current Estimated Value
Home Financials for this Owner
Home Financials are based on the most recent Mortgage that was taken out on this home.
Original Mortgage
$92,700
Outstanding Balance
$8,943
Interest Rate
7.85%
Estimated Equity
$321,338
Purchase Details
Closed on
May 6, 1996
Sold by
Kent Deborah N
Bought by
Kent Paul Frederick
Purchase Details
Closed on
Jul 31, 1995
Sold by
Kent Paul F
Bought by
Kent Deborah Nagle
Home Financials for this Owner
Home Financials are based on the most recent Mortgage that was taken out on this home.
Original Mortgage
$95,350
Interest Rate
7.39%
Mortgage Type
Assumption
Create a Home Valuation Report for This Property
The Home Valuation Report is an in-depth analysis detailing your home's value as well as a comparison with similar homes in the area
Home Values in the Area
Average Home Value in this Area
Purchase History
| Date | Buyer | Sale Price | Title Company |
|---|---|---|---|
| Cairns Paul G | -- | American Title Company | |
| Cairns Paul G | -- | American Title Company | |
| Kent Paul Frederick | -- | -- | |
| Kent Deborah Nagle | -- | -- |
Source: Public Records
Mortgage History
| Date | Status | Borrower | Loan Amount |
|---|---|---|---|
| Open | Cairns Paul G | $92,700 | |
| Closed | Cairns Paul G | $92,700 | |
| Previous Owner | Kent Deborah Nagle | $95,350 | |
| Closed | Kent Paul Frederick | $0 |
Source: Public Records
Tax History Compared to Growth
Tax History
| Year | Tax Paid | Tax Assessment Tax Assessment Total Assessment is a certain percentage of the fair market value that is determined by local assessors to be the total taxable value of land and additions on the property. | Land | Improvement |
|---|---|---|---|---|
| 2025 | $3,923 | $292,147 | $65,265 | $226,882 |
| 2024 | $3,923 | $306,783 | $65,265 | $241,518 |
| 2023 | $3,923 | $288,286 | $65,265 | $223,021 |
| 2022 | $5,520 | $269,107 | $52,141 | $216,966 |
| 2021 | $5,287 | $220,175 | $52,141 | $168,034 |
| 2020 | $5,024 | $203,632 | $37,244 | $166,388 |
| 2019 | $4,923 | $193,196 | $27,645 | $165,551 |
| 2018 | $1,880 | $194,475 | $27,645 | $166,830 |
| 2017 | $4,971 | $194,475 | $27,645 | $166,830 |
| 2016 | $4,565 | $178,607 | $22,808 | $155,799 |
| 2015 | $3,004 | $178,607 | $22,808 | $155,799 |
| 2014 | $3,004 | $163,003 | $19,006 | $143,997 |
Source: Public Records
Map
Nearby Homes
- 15010 Chetland Place Dr
- 15131 New Hastings Dr
- 8211 Riverglade Dr
- 14919 Forest Trails Dr
- 15339 Glenwood Park Dr
- 14931 Inverrary Dr
- 7827 Alamar Dr
- 14911 Sandalfoot St
- 8203 Green Devon Dr
- 15611 Meadow Village Dr
- 15362 Meadow Village Dr
- 15415 Swan Creek Dr
- 15414 Swan Creek Dr
- 7731 Club Lake Dr
- 8043 Oceanside Dr
- Highway 6 N & Huffmeister Rd
- 7637 Ameswood Rd
- 14502 Sandalfoot St
- 14519 Sandalfoot St
- 15854 Knolls Lodge Dr
- 15110 Chetland Place Dr
- 15118 Chetland Place Dr
- 15115 Easton Park Dr
- 15119 Easton Park Dr
- 15111 Easton Park Dr
- 15106 Chetland Place Dr
- 15122 Chetland Place Dr
- 15123 Easton Park Dr
- 15107 Easton Park Dr
- 15115 Chetland Place Dr
- 15119 Chetland Place Dr
- 15107 Chetland Place Dr
- 15127 Easton Park Dr
- 15102 Chetland Place Dr
- 15126 Chetland Place Dr
- 15103 Easton Park Dr
- 15127 Chetland Place Dr
- 15119 Forest Trails Dr
- 15131 Easton Park Dr
- 15114 Easton Park Dr