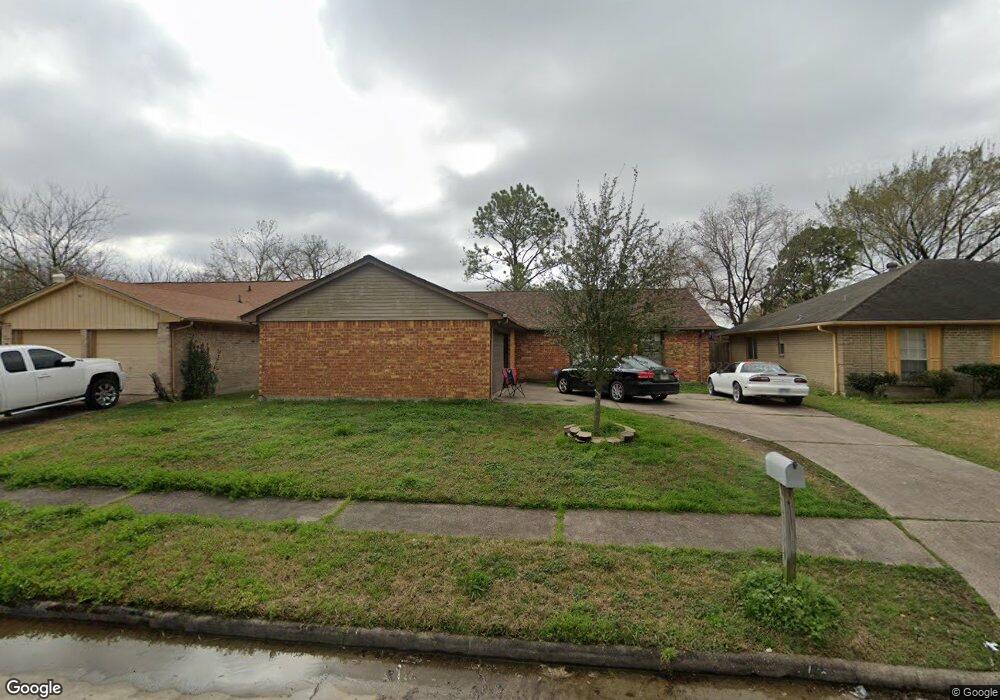
15118 Peachmeadow Ln Channelview, TX 77530
Estimated Value: $215,000 - $224,000
3
Beds
2
Baths
1,664
Sq Ft
$133/Sq Ft
Est. Value
About This Home
This home is located at 15118 Peachmeadow Ln, Channelview, TX 77530 and is currently estimated at $220,772, approximately $132 per square foot. 15118 Peachmeadow Ln is a home located in Harris County with nearby schools including Channelview High School and Family Christian Academy.
Ownership History
Date
Name
Owned For
Owner Type
Purchase Details
Closed on
Mar 11, 2022
Sold by
Verenice Mares
Bought by
Mares Joel Gabriel and Wolfe Madison R
Current Estimated Value
Purchase Details
Closed on
May 26, 2014
Sold by
Martinez Isabel
Bought by
Mares Verenice
Purchase Details
Closed on
Mar 26, 2008
Sold by
Us Bank Na
Bought by
Martinez Isabel
Home Financials for this Owner
Home Financials are based on the most recent Mortgage that was taken out on this home.
Original Mortgage
$67,400
Interest Rate
5.72%
Mortgage Type
Purchase Money Mortgage
Purchase Details
Closed on
Jan 1, 2008
Sold by
Rouse Jodie L and Rouse Sandy
Bought by
Us Bank Na and The Registered Holders Of Asst Backed Se
Purchase Details
Closed on
Feb 22, 1995
Sold by
Humphreys William W and Humphreys Barbara
Bought by
Rouse Jodie L
Create a Home Valuation Report for This Property
The Home Valuation Report is an in-depth analysis detailing your home's value as well as a comparison with similar homes in the area
Home Values in the Area
Average Home Value in this Area
Purchase History
| Date | Buyer | Sale Price | Title Company |
|---|---|---|---|
| Mares Joel Gabriel | -- | None Listed On Document | |
| Mares Verenice | -- | None Available | |
| Martinez Isabel | -- | Etc | |
| Us Bank Na | $79,050 | None Available | |
| Rouse Jodie L | -- | Texas American Title Company |
Source: Public Records
Mortgage History
| Date | Status | Borrower | Loan Amount |
|---|---|---|---|
| Previous Owner | Martinez Isabel | $67,400 |
Source: Public Records
Tax History Compared to Growth
Tax History
| Year | Tax Paid | Tax Assessment Tax Assessment Total Assessment is a certain percentage of the fair market value that is determined by local assessors to be the total taxable value of land and additions on the property. | Land | Improvement |
|---|---|---|---|---|
| 2025 | $3,032 | $204,190 | $37,015 | $167,175 |
| 2024 | $3,032 | $210,352 | $37,015 | $173,337 |
| 2023 | $3,032 | $216,626 | $37,015 | $179,611 |
| 2022 | $4,128 | $186,701 | $37,015 | $149,686 |
| 2021 | $3,975 | $162,278 | $37,015 | $125,263 |
| 2020 | $3,949 | $143,497 | $37,015 | $106,482 |
| 2019 | $3,921 | $139,302 | $31,075 | $108,227 |
| 2018 | $2,883 | $124,619 | $30,049 | $94,570 |
| 2017 | $3,125 | $124,619 | $30,049 | $94,570 |
| 2016 | $2,841 | $104,233 | $24,039 | $80,194 |
| 2015 | $2,184 | $93,578 | $13,823 | $79,755 |
| 2014 | $2,184 | $86,927 | $11,419 | $75,508 |
Source: Public Records
Map
Nearby Homes
- 1502 Stevenage Ln
- 15215 Peachmeadow Ln
- 15223 Bedford Glen Dr
- 15822 Mesenbrink Ln
- 16111 Marcelia Dr
- 1714 Laura Anne Dr
- 1343 Littleport Ln
- 15262 Mincing Ln
- 1330 Stevenage Ln
- 16206 Darrian Ln
- 16007 Makayla Dr
- 1738 Riane Ln
- 15911 Breanna Ln
- 1323 Padstow Ln
- 15307 Streatham Cir
- 1315 Goswell Ln
- 1802 Dominic Ln
- 14854 Shottery Dr
- 1727 Mickle Creek Dr
- 1423 Seafield Dr
- 15114 Peachmeadow Ln
- 15122 Peachmeadow Ln
- 1522 Somercotes Ln
- 1518 Somercotes Ln
- 15126 Peachmeadow Ln
- 15119 Peachmeadow Ln
- 1519 Somercotes Ln
- 15123 Peachmeadow Ln
- 15115 Peachmeadow Ln
- 15106 Peachmeadow Ln
- 1519 Willersley Ln
- 15130 Peachmeadow Ln
- 15127 Peachmeadow Ln
- 15111 Peachmeadow Ln
- 1514 Somercotes Ln
- 1522 Macclesby Ln
- 1515 Somercotes Ln
- 1515 Willersley Ln
- 1522 Willersley Ln
- 15102 Peachmeadow Ln