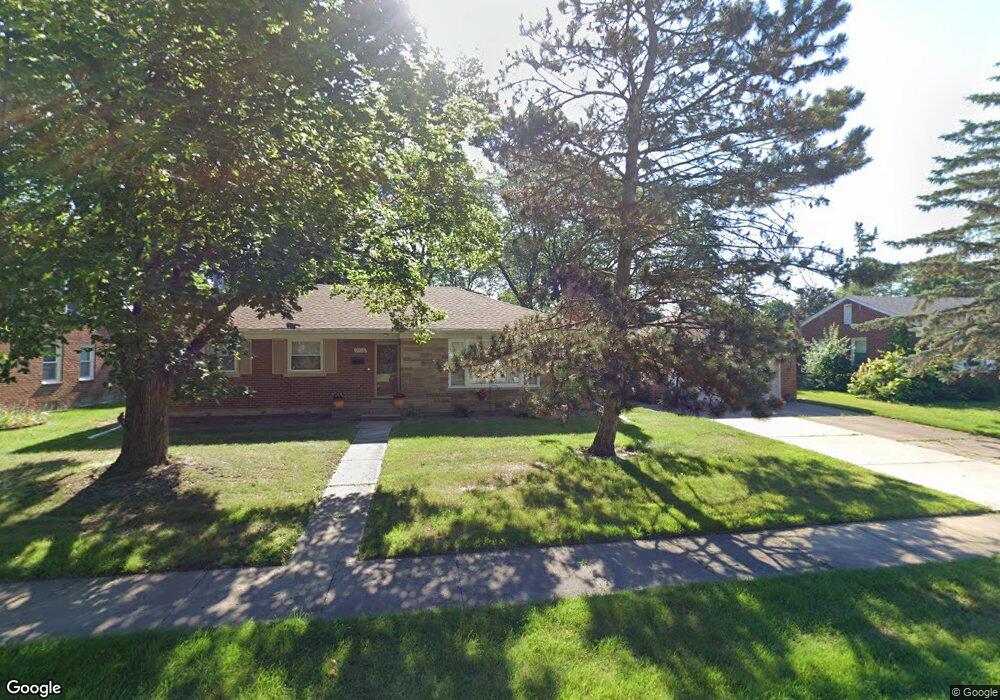
15118 Seminole Unit Bldg-Unit Redford, MI 48239
Estimated Value: $239,000 - $275,000
--
Bed
2
Baths
1,438
Sq Ft
$177/Sq Ft
Est. Value
About This Home
This home is located at 15118 Seminole Unit Bldg-Unit, Redford, MI 48239 and is currently estimated at $254,090, approximately $176 per square foot. 15118 Seminole Unit Bldg-Unit is a home located in Wayne County with nearby schools including Beech Elementary School, Hilbert Middle School, and Redford Union High School.
Ownership History
Date
Name
Owned For
Owner Type
Purchase Details
Closed on
Jun 30, 2020
Sold by
Brown Alesha M
Bought by
Brown Alesha M
Current Estimated Value
Purchase Details
Closed on
Jun 18, 2018
Sold by
Herman Paul
Bought by
Brown Alesha M
Purchase Details
Closed on
Nov 10, 2016
Sold by
C & S Management Group Llc
Bought by
Herman Paul
Purchase Details
Closed on
Aug 12, 2013
Sold by
North Shore Investment Group Llc
Bought by
C & S Management Grouup Llc
Purchase Details
Closed on
Jun 13, 2013
Sold by
Herman Paul Russell
Bought by
Northshore Investment Group Llc
Purchase Details
Closed on
Apr 25, 2013
Sold by
Herman Paul
Bought by
Spot Realty Inc
Purchase Details
Closed on
Sep 25, 2009
Sold by
Bruny Marilee Joanne
Bought by
Herman Paul
Purchase Details
Closed on
Mar 21, 2001
Sold by
Bruny Irene
Bought by
Bruny Richard L
Create a Home Valuation Report for This Property
The Home Valuation Report is an in-depth analysis detailing your home's value as well as a comparison with similar homes in the area
Home Values in the Area
Average Home Value in this Area
Purchase History
| Date | Buyer | Sale Price | Title Company |
|---|---|---|---|
| Brown Alesha M | -- | None Available | |
| Brown Alesha M | $146,500 | None Available | |
| Herman Paul | $77,000 | Reputation First Title Agenc | |
| C & S Management Grouup Llc | -- | None Available | |
| Northshore Investment Group Llc | -- | None Available | |
| Spot Realty Inc | $37,541 | None Available | |
| Herman Paul | $82,000 | None Available | |
| Bruny Richard L | -- | -- |
Source: Public Records
Tax History Compared to Growth
Tax History
| Year | Tax Paid | Tax Assessment Tax Assessment Total Assessment is a certain percentage of the fair market value that is determined by local assessors to be the total taxable value of land and additions on the property. | Land | Improvement |
|---|---|---|---|---|
| 2025 | $1,995 | $113,800 | $0 | $0 |
| 2024 | $1,995 | $109,200 | $0 | $0 |
| 2023 | $1,903 | $96,600 | $0 | $0 |
| 2022 | $4,461 | $85,700 | $0 | $0 |
| 2021 | $4,337 | $80,700 | $0 | $0 |
| 2020 | $4,275 | $72,600 | $0 | $0 |
| 2019 | $5,363 | $65,200 | $0 | $0 |
| 2018 | $1,584 | $58,800 | $0 | $0 |
| 2017 | $4,419 | $57,200 | $0 | $0 |
| 2016 | $2,523 | $49,700 | $0 | $0 |
| 2015 | $3,749 | $45,200 | $0 | $0 |
| 2013 | $3,760 | $37,600 | $0 | $0 |
| 2012 | $2,554 | $42,000 | $11,000 | $31,000 |
Source: Public Records
Map
Nearby Homes
- 14844 Inkster Rd
- 27480 5 Mile Rd
- 27510 Five Mile Rd
- 15660 Meadowbrook Rd
- 15705 Green Lane Ave
- 27497 Oakley St
- 15681 Foch St
- 15654 Denby
- 27416 Sunnydale St
- 14396 Inkster Rd
- 14378 Seminole
- 15627 Delaware Ave
- 14328 Brook Dr
- 15618 Lexington
- 14174 San Jose
- 15844 Lexington
- 15988 Delaware Ave
- 14068 Mercedes
- 28692 Bayberry Park Dr
- 14008 Mercedes
- 15118 Seminole
- 15100 Seminole
- VAC Seminole
- 15067 Kipke
- 15136 Seminole
- 15095 Kipke
- 15111 Seminole
- 15095 Seminole
- 15078 Seminole
- 15055 Kipke
- 15119 Kipke
- 15135 Seminole
- 27219 5 Mile Rd
- 27245 Five Mile Rd
- 27231 5 Mile Rd
- 27245 5 Mile Rd
- 15060 Seminole
- 15045 Kipke
- 27207 5 Mile Rd Unit Bldg-Unit
- 27207 5 Mile Rd