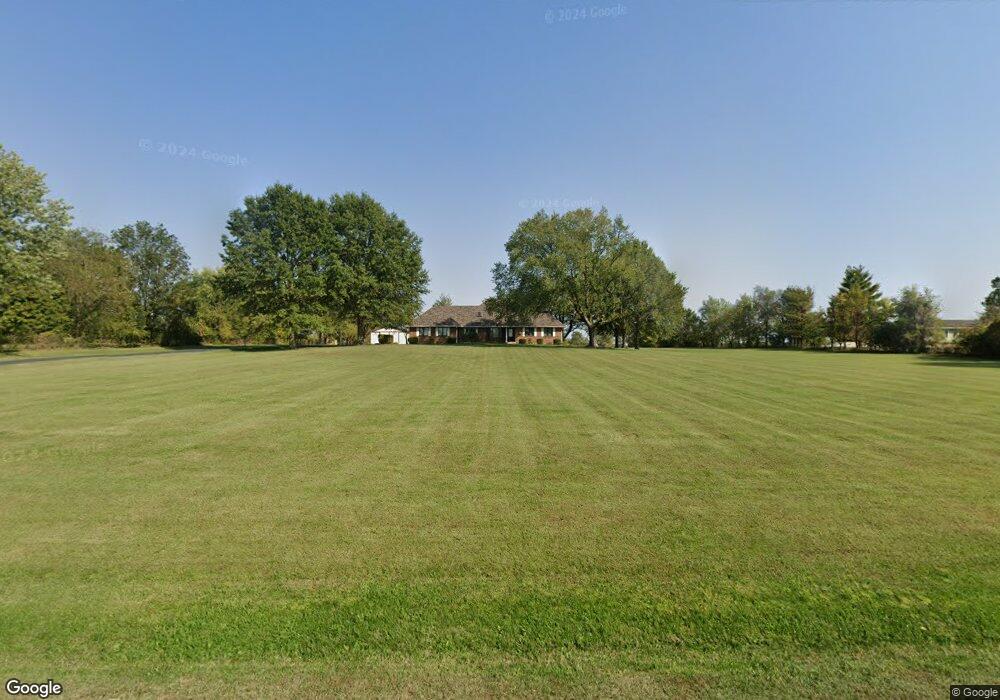
15119 S Smart Rd Greenwood, MO 64034
Estimated Value: $807,514 - $873,000
4
Beds
4
Baths
2,399
Sq Ft
$350/Sq Ft
Est. Value
About This Home
This home is located at 15119 S Smart Rd, Greenwood, MO 64034 and is currently estimated at $840,257, approximately $350 per square foot. 15119 S Smart Rd is a home located in Jackson County with nearby schools including Woodland Elementary School, Pleasant Lea Middle School, and Lee's Summit Senior High School.
Ownership History
Date
Name
Owned For
Owner Type
Purchase Details
Closed on
Jul 23, 2008
Sold by
Schmitz Stephen L and Schmitz Mary Ann
Bought by
Grannan Clement M and Schmitz Sara E
Current Estimated Value
Home Financials for this Owner
Home Financials are based on the most recent Mortgage that was taken out on this home.
Original Mortgage
$500,000
Interest Rate
6.36%
Mortgage Type
Seller Take Back
Purchase Details
Closed on
Mar 14, 2008
Sold by
Pietarila James D
Bought by
Schmitz Stephen L and Schmitz Mary Ann
Purchase Details
Closed on
Jun 7, 2002
Sold by
Edson Noel M
Bought by
Pietarila Darrell M and Pietarila Sharon L
Home Financials for this Owner
Home Financials are based on the most recent Mortgage that was taken out on this home.
Original Mortgage
$270,800
Interest Rate
6.77%
Mortgage Type
Purchase Money Mortgage
Create a Home Valuation Report for This Property
The Home Valuation Report is an in-depth analysis detailing your home's value as well as a comparison with similar homes in the area
Home Values in the Area
Average Home Value in this Area
Purchase History
| Date | Buyer | Sale Price | Title Company |
|---|---|---|---|
| Grannan Clement M | -- | None Available | |
| Schmitz Stephen L | -- | Kansas City Title | |
| Pietarila Darrell M | -- | Kansas City Title |
Source: Public Records
Mortgage History
| Date | Status | Borrower | Loan Amount |
|---|---|---|---|
| Closed | Grannan Clement M | $500,000 | |
| Previous Owner | Pietarila Darrell M | $270,800 |
Source: Public Records
Tax History Compared to Growth
Tax History
| Year | Tax Paid | Tax Assessment Tax Assessment Total Assessment is a certain percentage of the fair market value that is determined by local assessors to be the total taxable value of land and additions on the property. | Land | Improvement |
|---|---|---|---|---|
| 2025 | $5,533 | $58,580 | $9,768 | $48,812 |
| 2024 | $13,036 | $79,374 | $4,144 | $75,230 |
| 2023 | $13,036 | $79,374 | $4,144 | $75,230 |
| 2022 | $10,959 | $43,352 | $2,483 | $40,869 |
| 2021 | $10,805 | $43,352 | $2,483 | $40,869 |
| 2020 | $10,735 | $41,296 | $2,483 | $38,813 |
| 2019 | $10,621 | $41,296 | $2,483 | $38,813 |
| 2018 | $2,990 | $36,477 | $2,484 | $33,993 |
| 2017 | $2,934 | $36,477 | $2,484 | $33,993 |
| 2016 | $2,934 | $35,465 | $2,484 | $32,981 |
| 2014 | $2,997 | $35,437 | $2,456 | $32,981 |
Source: Public Records
Map
Nearby Homes
- 14804 Smart Rd
- 1149 Hummingbird Ct
- 35100 E Outer Belt Rd
- The Ashton Plan at Woodland Trails - Estate Homes
- The Watkins Plan at Woodland Trails - Estate Homes
- The Magnolia IV Plan at Woodland Trails - Estate Homes
- 1433 Woodland Rd
- 1420 Woodland Rd
- 1586 Woodland Rd
- 805 Savannah Dr
- 802 Savannah Ct
- 806 Savannah Ct
- 907 Savannah Ln
- 908 Savannah Ln
- 911 Savannah Ln
- 917 Savannah Ln
- 512 Wilds Pkwy
- 1010 Wilds Pkwy
- 1011 Wilds Pkwy
- The Breckenridge Plan at Lake Winnebago
- 15105 S Smart Rd
- 15201 S Smart Rd
- 15014 S Smart Rd
- 15305 S Smart Rd
- 15202 S Smart Rd
- 14916 S Smart Rd
- 15500 S Smart Rd
- 14818 S Smart Rd
- 14819 S Smart Rd
- 14604 S Smart Rd
- 14620 S Smart Rd
- 14612 S Smart Rd
- 14522 S Smart Rd
- 14406 S Smart Rd
- 14414 S Smart Rd
- 14322 S Smart Rd
- 14314 S Smart Rd
- 14300 S Smart Rd
- 15302 S Smart Rd
- 14816 S Smart Rd