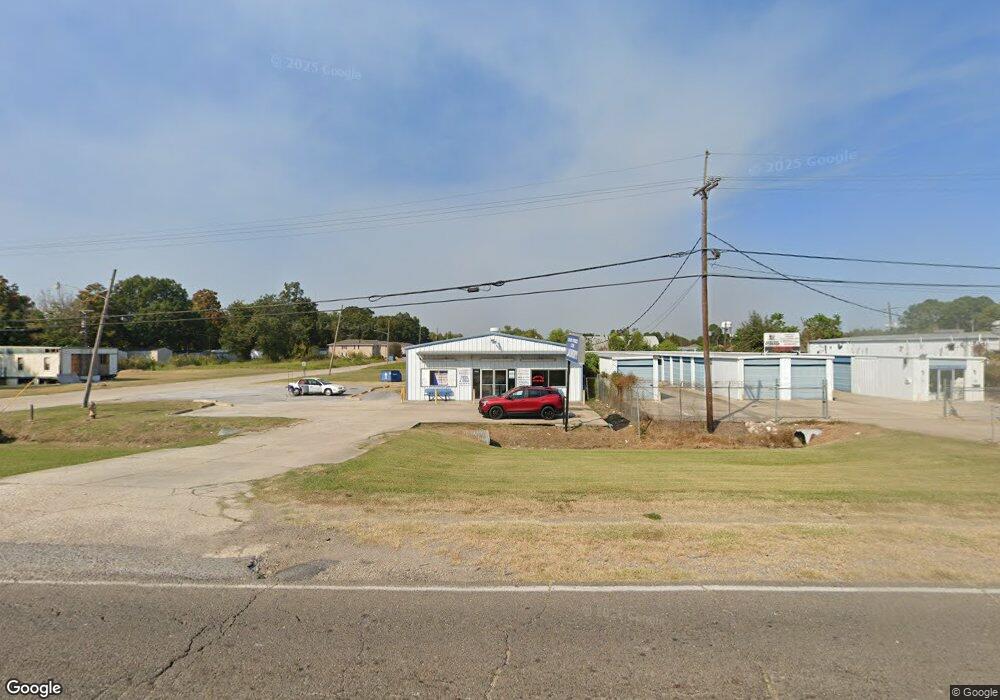
1512 Court St Port Allen, LA 70767
Estimated Value: $275,372
--
Bed
--
Bath
2,794
Sq Ft
$99/Sq Ft
Est. Value
About This Home
This home is located at 1512 Court St, Port Allen, LA 70767 and is currently estimated at $275,372, approximately $98 per square foot. 1512 Court St is a home located in West Baton Rouge Parish with nearby schools including Port Allen Elementary School, Cohn Elementary School, and Port Allen Middle School.
Ownership History
Date
Name
Owned For
Owner Type
Purchase Details
Closed on
Mar 27, 2025
Sold by
Toe Properties Llc
Bought by
Blak Diamond Investments 2 Llc
Current Estimated Value
Home Financials for this Owner
Home Financials are based on the most recent Mortgage that was taken out on this home.
Original Mortgage
$62,860
Outstanding Balance
$62,593
Interest Rate
6.87%
Mortgage Type
New Conventional
Estimated Equity
$212,779
Purchase Details
Closed on
Jun 24, 2020
Sold by
Estd Properties Llc
Bought by
Toe Properties Llc
Purchase Details
Closed on
May 1, 2017
Sold by
Dragonfly Llc
Bought by
Estd Properties Llc
Purchase Details
Closed on
Aug 1, 2008
Sold by
Abita Properties Inc
Bought by
Dragonfly Llc
Purchase Details
Closed on
Sep 2, 2005
Sold by
Bilco Washateria & Dry Cleaning Llc
Bought by
Abita Properties Inc
Create a Home Valuation Report for This Property
The Home Valuation Report is an in-depth analysis detailing your home's value as well as a comparison with similar homes in the area
Home Values in the Area
Average Home Value in this Area
Purchase History
| Date | Buyer | Sale Price | Title Company |
|---|---|---|---|
| Blak Diamond Investments 2 Llc | $314,300 | New Life Title Company Llc | |
| Blak Diamond Investments 2 Llc | $314,300 | New Life Title Company Llc | |
| Toe Properties Llc | $225,000 | None Available | |
| Estd Properties Llc | -- | Title Second Title | |
| Dragonfly Llc | $175,000 | None Available | |
| Abita Properties Inc | $175,000 | None Available |
Source: Public Records
Mortgage History
| Date | Status | Borrower | Loan Amount |
|---|---|---|---|
| Open | Blak Diamond Investments 2 Llc | $62,860 | |
| Closed | Blak Diamond Investments 2 Llc | $62,860 |
Source: Public Records
Tax History Compared to Growth
Tax History
| Year | Tax Paid | Tax Assessment Tax Assessment Total Assessment is a certain percentage of the fair market value that is determined by local assessors to be the total taxable value of land and additions on the property. | Land | Improvement |
|---|---|---|---|---|
| 2024 | $2,793 | $25,610 | $5,400 | $20,210 |
| 2023 | $3,148 | $27,130 | $4,750 | $22,380 |
| 2022 | $3,176 | $27,130 | $4,750 | $22,380 |
| 2021 | $3,241 | $27,130 | $4,750 | $22,380 |
| 2020 | $2,943 | $24,420 | $4,280 | $20,140 |
| 2019 | $3,201 | $25,470 | $4,360 | $21,110 |
| 2018 | $3,253 | $25,470 | $4,360 | $21,110 |
| 2017 | $3,029 | $25,470 | $4,360 | $21,110 |
| 2015 | $2,242 | $22,680 | $1,910 | $20,770 |
| 2014 | $2,215 | $22,680 | $1,910 | $20,770 |
| 2013 | $2,215 | $22,680 | $1,910 | $20,770 |
Source: Public Records
Map
Nearby Homes
- 309 N 14th St
- 245 Melissa Dr
- 332 Gladiolus St
- 289 Melissa Dr
- 1702 Court St
- 755 Maryland Ave
- 2105 Taylor Dr
- 238 Whitehead Blvd
- 926 Louisiana Ave
- 2165 Taylor Dr
- 557 Avenue C
- 235 N Jefferson Ave
- 3459 Louisiana 1
- 2108 Sherri's
- 2148 Sherri's Way
- 2026 Sherri's Way
- 2168 Sherri's Way
- 2046 Sherri's Way
- 2086 Sherri's Way
- 2138 Sherri's Way