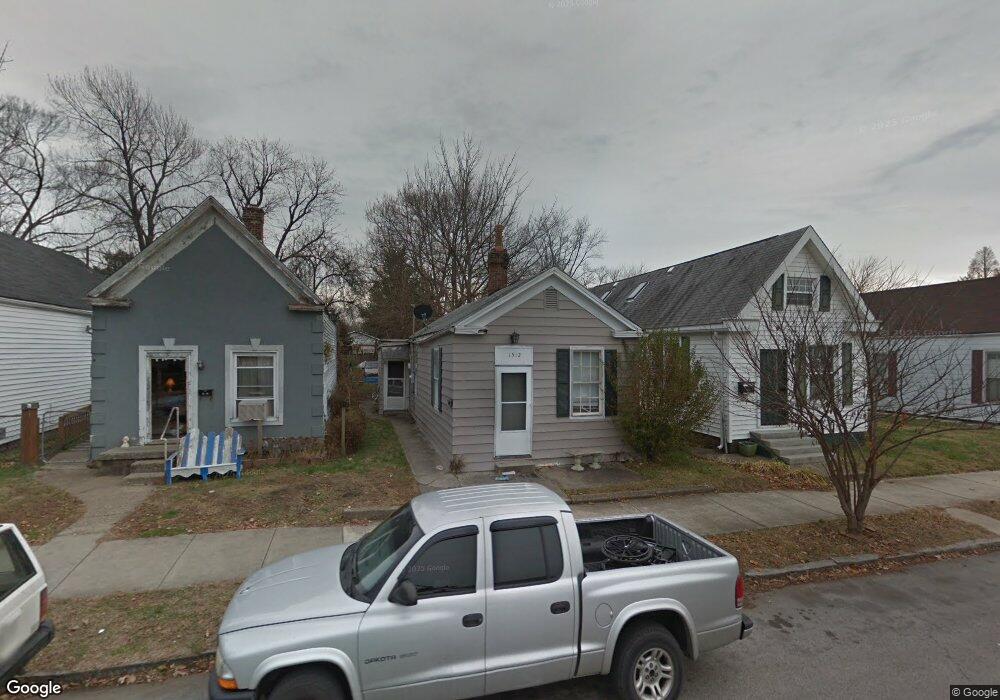
1512 Culbertson Ave New Albany, IN 47150
Estimated Value: $108,058 - $141,000
2
Beds
1
Bath
792
Sq Ft
$164/Sq Ft
Est. Value
About This Home
This home is located at 1512 Culbertson Ave, New Albany, IN 47150 and is currently estimated at $129,765, approximately $163 per square foot. 1512 Culbertson Ave is a home located in Floyd County with nearby schools including S. Ellen Jones Elementary School, Hazelwood Middle School, and New Albany Senior High School.
Ownership History
Date
Name
Owned For
Owner Type
Purchase Details
Closed on
Dec 30, 2009
Sold by
Primary Residential Mortgage Inc
Bought by
Hoagland Byron E
Current Estimated Value
Purchase Details
Closed on
Dec 1, 2009
Sold by
Davis Dawn
Bought by
Primary Residential Mortgage Inc
Purchase Details
Closed on
Jul 20, 2007
Sold by
Davis Dawn
Bought by
R Davis Family Enterprises Inc
Home Financials for this Owner
Home Financials are based on the most recent Mortgage that was taken out on this home.
Original Mortgage
$26,600
Interest Rate
6.73%
Mortgage Type
New Conventional
Purchase Details
Closed on
Apr 10, 2007
Sold by
Davis Raymond C
Bought by
Davis Dawn
Purchase Details
Closed on
Mar 20, 2007
Sold by
Federal Home Loan Mortgage Corporation
Bought by
Davis Raymond C
Purchase Details
Closed on
Nov 17, 2006
Sold by
Birdsong Betsy and Chrisman Julia D
Bought by
Federal Home Loan Mortgage Corporation
Create a Home Valuation Report for This Property
The Home Valuation Report is an in-depth analysis detailing your home's value as well as a comparison with similar homes in the area
Home Values in the Area
Average Home Value in this Area
Purchase History
| Date | Buyer | Sale Price | Title Company |
|---|---|---|---|
| Hoagland Byron E | -- | None Available | |
| Primary Residential Mortgage Inc | $10,000 | None Available | |
| R Davis Family Enterprises Inc | -- | None Available | |
| Davis Dawn | -- | None Available | |
| Davis Raymond C | -- | None Available | |
| Federal Home Loan Mortgage Corporation | $36,900 | None Available |
Source: Public Records
Mortgage History
| Date | Status | Borrower | Loan Amount |
|---|---|---|---|
| Previous Owner | R Davis Family Enterprises Inc | $26,600 |
Source: Public Records
Tax History Compared to Growth
Tax History
| Year | Tax Paid | Tax Assessment Tax Assessment Total Assessment is a certain percentage of the fair market value that is determined by local assessors to be the total taxable value of land and additions on the property. | Land | Improvement |
|---|---|---|---|---|
| 2024 | $1,439 | $58,200 | $10,700 | $47,500 |
| 2023 | $2,362 | $49,500 | $10,700 | $38,800 |
| 2022 | $1,106 | $50,900 | $10,700 | $40,200 |
| 2021 | $983 | $44,900 | $10,700 | $34,200 |
| 2020 | $953 | $43,500 | $10,700 | $32,800 |
| 2019 | $903 | $41,300 | $10,700 | $30,600 |
| 2018 | $850 | $38,700 | $10,700 | $28,000 |
| 2017 | $1,645 | $38,900 | $10,700 | $28,200 |
| 2016 | $1,305 | $38,600 | $10,700 | $27,900 |
| 2014 | $1,211 | $44,900 | $10,700 | $34,200 |
| 2013 | -- | $46,200 | $10,700 | $35,500 |
Source: Public Records
Map
Nearby Homes
- 1605 Culbertson Ave
- 608 E Oak St
- 1313 Culbertson Ave
- 1314 Ekin Ave
- 1727 E Oak St
- 830 Cedar Bough Place
- 1205 Ekin Ave
- 1748 E Oak St
- 1119 Ekin Ave
- 1809 E Oak St
- 336 E 16th St
- 1011 Vincennes St Unit 5
- 330 E 16th St
- 335 E 15th St
- 1743 E Spring St
- 1314 Chartres St
- 1619 King St
- 1617 King St
- 1120 Chartres St
- 1406 Chartres St
- 1510 Culbertson Ave
- 1516 Culbertson Ave
- 1506 Culbertson Ave
- 1518 Culbertson Ave
- 1504 Culbertson Ave
- 1502 Culbertson Ave
- 1522 Culbertson Ave
- 1524 Culbertson Ave
- 1503 E Oak St
- 1511 E Oak St
- 1509 E Oak St
- 1515 E Oak St
- 1507 E Oak St
- 1602 Culbertson Ave
- 1517 E Oak St
- 1505 E Oak St
- 1509 Culbertson Ave
- 1515 Culbertson Ave
- 1424 Culbertson Ave
- 1505 Culbertson Ave