Estimated Value: $271,253 - $363,000
4
Beds
2
Baths
2,025
Sq Ft
$155/Sq Ft
Est. Value
About This Home
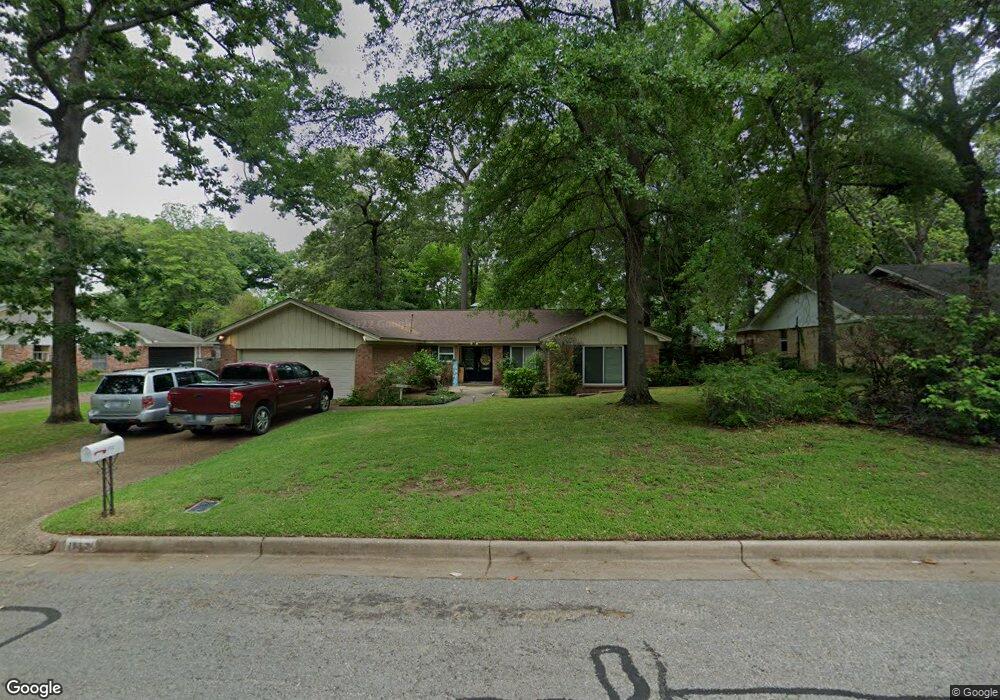
This home is located at 1512 Devonshire Dr, Tyler, TX 75703 and is currently estimated at $313,563, approximately $154 per square foot. 1512 Devonshire Dr is a home located in Smith County with nearby schools including Woods Elementary School, Hubbard Middle School, and Tyler Legacy High School.
Ownership History
Date
Name
Owned For
Owner Type
Purchase Details
Closed on
Oct 28, 2024
Sold by
Cornelius Matthew and Cornelius Jaime
Bought by
Dr 1512 Devonshire and Cornelius Re Llc
Current Estimated Value
Home Financials for this Owner
Home Financials are based on the most recent Mortgage that was taken out on this home.
Original Mortgage
$1,235,000
Outstanding Balance
$1,209,400
Interest Rate
6.09%
Mortgage Type
New Conventional
Estimated Equity
-$895,837
Purchase Details
Closed on
Nov 30, 2007
Sold by
Culver Matthew R and Culver Donna L
Bought by
Cornelius Matthew
Home Financials for this Owner
Home Financials are based on the most recent Mortgage that was taken out on this home.
Original Mortgage
$138,700
Interest Rate
6.43%
Mortgage Type
Purchase Money Mortgage
Purchase Details
Closed on
Nov 21, 2005
Sold by
Jamison Charles V and Jamison Evelyn C
Bought by
Culver Matthew R and Culver Donna L
Create a Home Valuation Report for This Property
The Home Valuation Report is an in-depth analysis detailing your home's value as well as a comparison with similar homes in the area
Purchase History
| Date | Buyer | Sale Price | Title Company |
|---|---|---|---|
| Dr 1512 Devonshire | -- | None Listed On Document | |
| Cornelius Matthew | -- | None Available | |
| Culver Matthew R | -- | None Available |
Source: Public Records
Mortgage History
| Date | Status | Borrower | Loan Amount |
|---|---|---|---|
| Open | Dr 1512 Devonshire | $1,235,000 | |
| Previous Owner | Cornelius Matthew | $138,700 |
Source: Public Records
Tax History
| Year | Tax Paid | Tax Assessment Tax Assessment Total Assessment is a certain percentage of the fair market value that is determined by local assessors to be the total taxable value of land and additions on the property. | Land | Improvement |
|---|---|---|---|---|
| 2025 | $4,388 | $257,910 | $52,933 | $204,977 |
| 2024 | $4,601 | $270,425 | $41,180 | $229,245 |
| 2023 | $4,634 | $265,841 | $41,180 | $224,661 |
| 2022 | $4,522 | $230,793 | $41,180 | $189,613 |
| 2021 | $3,953 | $188,433 | $41,180 | $147,253 |
| 2020 | $3,888 | $181,689 | $41,180 | $140,509 |
| 2019 | $7,009 | $158,606 | $20,590 | $138,016 |
| 2018 | $3,192 | $146,775 | $20,590 | $126,185 |
| 2017 | $3,242 | $151,871 | $20,590 | $131,281 |
| 2016 | $3,365 | $157,628 | $20,590 | $137,038 |
| 2015 | $2,848 | $151,838 | $20,590 | $131,248 |
| 2014 | $2,848 | $145,255 | $20,590 | $124,665 |
Source: Public Records
Map
Nearby Homes
- 4728 Downing St
- 1506 Devonshire Dr
- 4709 Chad Dr
- 1505 Everglades Dr
- 1818 Kensington Dr
- 5028 Chad Dr
- 1116 Kingspark Dr
- 1816 Chipco Dr
- 1813 Sequoia Dr
- 1608 Yosemite Dr
- 1812 Sequoia Dr
- 1716 Yosemite Dr
- 842 Ashford Ct
- 1107 Pinedale Place
- 4913 Pine Knoll Dr
- 4211 Birdwell Dr
- 2043 Shiloh Rd
- 4205 Birdwell Dr
- 2112 Highmont Ct
- 4107 Chester Dr
- 1512 1512 Devonshire
- 1520 Devonshire Dr
- 1521 Kensington Dr
- 1521 1521 Kensington
- 1523 Kensington Dr
- 1507 Kensington Dr
- 1511 Devonshire Dr
- 1500 Devonshire Dr
- 1528 Devonshire Dr
- 1528 1528 Devonshire
- 4717 Kidd Dr
- 1501 Kensington Dr
- 1529 Kensington Dr
- 4717 4717 Kidd Dr
- 4722 4722 Downing
- 4722 Downing St
- 1421 1421 Devonshire
- 1422 Devonshire Dr
- 1421 Devonshire Dr
- 4721 Kidd Dr
Your Personal Tour Guide
Ask me questions while you tour the home.