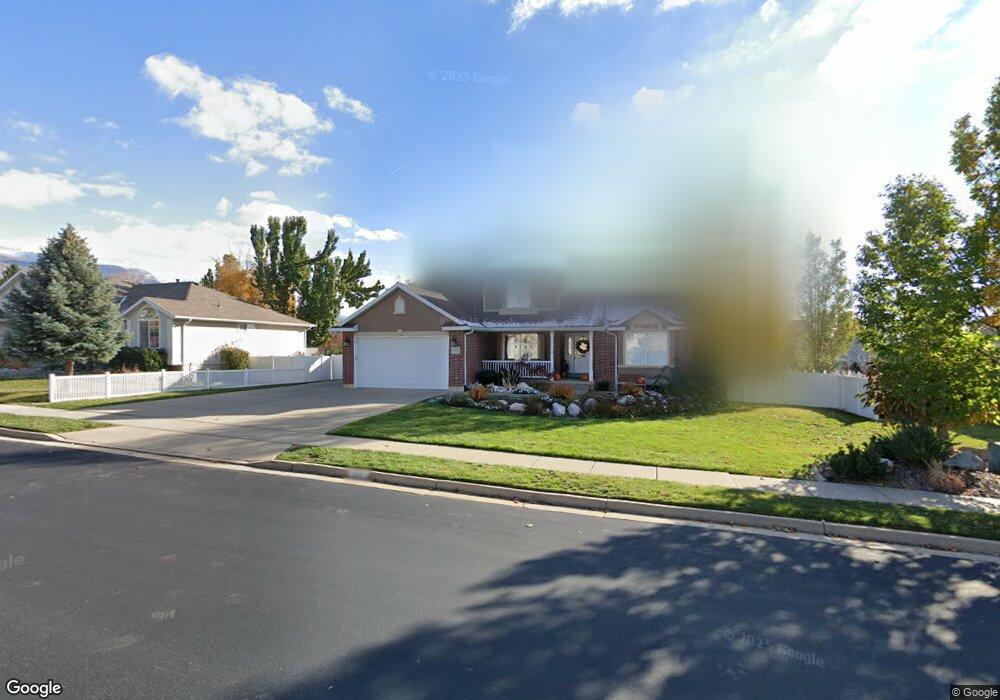
1512 E 575 N Layton, UT 84040
Estimated Value: $633,090 - $783,000
--
Bed
4
Baths
2,135
Sq Ft
$325/Sq Ft
Est. Value
About This Home
This home is located at 1512 E 575 N, Layton, UT 84040 and is currently estimated at $693,523, approximately $324 per square foot. 1512 E 575 N is a home located in Davis County with nearby schools including King Elementary School, Central Davis Junior High School, and Layton High School.
Ownership History
Date
Name
Owned For
Owner Type
Purchase Details
Closed on
Feb 19, 2014
Sold by
Boman Rex W and Boman Loujean D
Bought by
The Loujean D Boman Trust and Boman Rex W
Current Estimated Value
Purchase Details
Closed on
Jan 4, 2005
Sold by
Boman Rex M and Boman Lou Jean D
Bought by
Boman Loudean D
Purchase Details
Closed on
Aug 21, 1997
Sold by
Nilson & Company Inc
Bought by
Boman Rex W and Boman Lou Jean D
Home Financials for this Owner
Home Financials are based on the most recent Mortgage that was taken out on this home.
Original Mortgage
$196,000
Interest Rate
7.45%
Purchase Details
Closed on
Nov 27, 1996
Sold by
Southridge Development Corp
Bought by
Nilson & Company Inc and Nilson Homes
Home Financials for this Owner
Home Financials are based on the most recent Mortgage that was taken out on this home.
Original Mortgage
$40,502
Interest Rate
7.86%
Create a Home Valuation Report for This Property
The Home Valuation Report is an in-depth analysis detailing your home's value as well as a comparison with similar homes in the area
Home Values in the Area
Average Home Value in this Area
Purchase History
| Date | Buyer | Sale Price | Title Company |
|---|---|---|---|
| The Loujean D Boman Trust | -- | None Available | |
| Boman Loudean D | -- | None Available | |
| Boman Rex W | -- | Bonneville Title Company Inc | |
| Nilson & Company Inc | -- | Bonneville Title Company Inc |
Source: Public Records
Mortgage History
| Date | Status | Borrower | Loan Amount |
|---|---|---|---|
| Previous Owner | Boman Rex W | $196,000 | |
| Previous Owner | Nilson & Company Inc | $40,502 |
Source: Public Records
Tax History
| Year | Tax Paid | Tax Assessment Tax Assessment Total Assessment is a certain percentage of the fair market value that is determined by local assessors to be the total taxable value of land and additions on the property. | Land | Improvement |
|---|---|---|---|---|
| 2025 | $3,304 | $308,550 | $139,916 | $168,634 |
| 2024 | $3,155 | $297,550 | $160,848 | $136,702 |
| 2023 | $3,180 | $534,000 | $210,948 | $323,052 |
| 2022 | $3,314 | $305,250 | $113,667 | $191,583 |
| 2021 | $3,115 | $427,000 | $173,818 | $253,182 |
| 2020 | $2,875 | $377,000 | $144,072 | $232,928 |
| 2019 | $2,803 | $362,000 | $127,975 | $234,025 |
| 2018 | $2,607 | $338,000 | $102,254 | $235,746 |
| 2016 | $2,459 | $168,080 | $53,266 | $114,814 |
| 2015 | $2,286 | $147,785 | $53,266 | $94,519 |
| 2014 | $2,272 | $150,360 | $53,266 | $97,094 |
| 2013 | -- | $141,026 | $38,490 | $102,536 |
Source: Public Records
Map
Nearby Homes
- 1503 E 530 N
- 1545 E 975 N
- 479 N 1375 E
- 1515 E Gentile St
- 1156 Cherrywood Dr
- 2877 E Gentile St Unit 2
- 1033 E 825 N
- 997 E 825 N
- 1148 N 1875 E Unit 2
- 508 N Adamswood Rd
- 556 N Fairfield Rd Unit A2
- 556 N Fairfield Rd Unit D1
- 556 N Fairfield Rd Unit D2
- 556 N Fairfield Rd Unit A3
- 556 N Fairfield Rd Unit D3
- 556 N Fairfield Rd Unit D4
- 556 N Fairfield Rd Unit A1
- 556 N Fairfield Rd Unit A4
- 861 E 575 N
- 187 N Talbot Dr
Your Personal Tour Guide
Ask me questions while you tour the home.