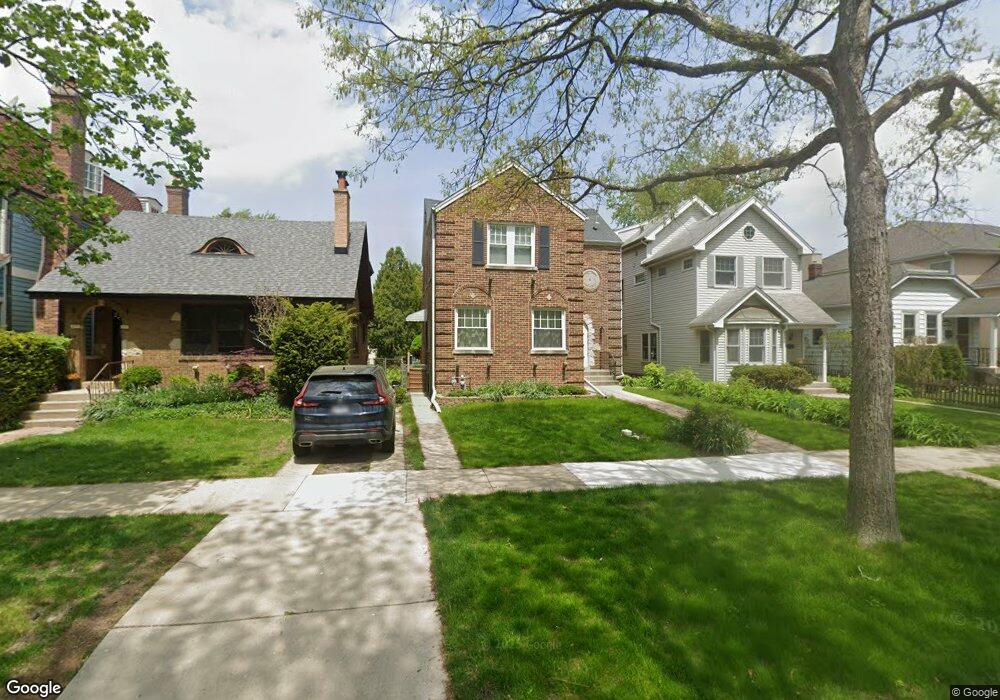
1512 Maple Ave Wilmette, IL 60091
Estimated Value: $808,877 - $1,070,000
3
Beds
2
Baths
1,894
Sq Ft
$501/Sq Ft
Est. Value
About This Home
This home is located at 1512 Maple Ave, Wilmette, IL 60091 and is currently estimated at $948,969, approximately $501 per square foot. 1512 Maple Ave is a home located in Cook County with nearby schools including McKenzie Elementary School, Highcrest Middle School, and Wilmette Junior High School.
Ownership History
Date
Name
Owned For
Owner Type
Purchase Details
Closed on
Jan 6, 2012
Sold by
Ziaya Josephine and Berube Martha A
Bought by
Ziaya Josephine and Berube Martha A
Current Estimated Value
Purchase Details
Closed on
Nov 16, 2001
Sold by
Lyerly Patricia J
Bought by
Ziaya Josephine and Berube Martha A
Home Financials for this Owner
Home Financials are based on the most recent Mortgage that was taken out on this home.
Original Mortgage
$150,000
Interest Rate
6.87%
Purchase Details
Closed on
Jan 4, 1994
Sold by
Lasalle National Trust Na
Bought by
Lyerly Patricia J
Home Financials for this Owner
Home Financials are based on the most recent Mortgage that was taken out on this home.
Original Mortgage
$226,000
Interest Rate
4.75%
Create a Home Valuation Report for This Property
The Home Valuation Report is an in-depth analysis detailing your home's value as well as a comparison with similar homes in the area
Home Values in the Area
Average Home Value in this Area
Purchase History
| Date | Buyer | Sale Price | Title Company |
|---|---|---|---|
| Ziaya Josephine | -- | None Available | |
| Ziaya Josephine | $479,000 | -- | |
| Lyerly Patricia J | $188,333 | -- |
Source: Public Records
Mortgage History
| Date | Status | Borrower | Loan Amount |
|---|---|---|---|
| Previous Owner | Ziaya Josephine | $150,000 | |
| Previous Owner | Lyerly Patricia J | $226,000 |
Source: Public Records
Tax History
| Year | Tax Paid | Tax Assessment Tax Assessment Total Assessment is a certain percentage of the fair market value that is determined by local assessors to be the total taxable value of land and additions on the property. | Land | Improvement |
|---|---|---|---|---|
| 2025 | $10,453 | $76,921 | $18,428 | $58,493 |
| 2024 | $10,453 | $49,382 | $15,593 | $33,789 |
| 2023 | $11,653 | $57,678 | $15,593 | $42,085 |
| 2022 | $11,653 | $57,678 | $15,593 | $42,085 |
| 2021 | $12,365 | $50,925 | $11,340 | $39,585 |
| 2020 | $13,878 | $57,409 | $11,340 | $46,069 |
| 2019 | $13,453 | $62,402 | $11,340 | $51,062 |
| 2018 | $12,173 | $54,602 | $9,639 | $44,963 |
| 2017 | $12,539 | $57,578 | $9,639 | $47,939 |
| 2016 | $12,338 | $59,261 | $9,639 | $49,622 |
| 2015 | $10,215 | $43,772 | $7,938 | $35,834 |
| 2014 | $10,866 | $47,049 | $7,938 | $39,111 |
| 2013 | $11,406 | $51,518 | $7,938 | $43,580 |
Source: Public Records
Map
Nearby Homes
- 1531 Wilmette Ave
- 125 15th St
- 1521 Gregory Ave
- 1420 Isabella St
- 1620 Washington Ave
- 2716 Ewing Ave
- 1209 Maple Ave
- 111 Park Ave
- 509 1/2 Ridge Rd
- 2508 Isabella St
- 814 Park Ave
- 601 Ridge Rd Unit 202
- 1917 Washington Ave
- 2500 Thayer St
- 411 Pine Manor Dr
- 621 Green Bay Rd
- 1933 Washington Ave
- 715 Ridge Rd Unit 1BN
- 800 Ridge Rd Unit 117
- 2726 Central St Unit 2D
- 1510 Maple Ave
- 1514 Maple Ave
- 1508 Maple Ave
- 1518 Maple Ave
- 1520 Maple Ave
- 1500 Maple Ave
- 1522 Maple Ave
- 315 15th St
- 1511 Wilmette Ave
- 1515 Wilmette Ave
- 1501 Maple Ave
- 1517 Wilmette Ave
- 1509 Wilmette Ave
- 1532 Maple Ave
- 1523 Wilmette Ave
- 1505 Wilmette Ave
- 1513 Maple Ave
- 1517 Maple Ave
- 1525 Wilmette Ave
- 1519 Maple Ave
Your Personal Tour Guide
Ask me questions while you tour the home.