Estimated Value: $115,879
3
Beds
2
Baths
1,674
Sq Ft
$69/Sq Ft
Est. Value
About This Home
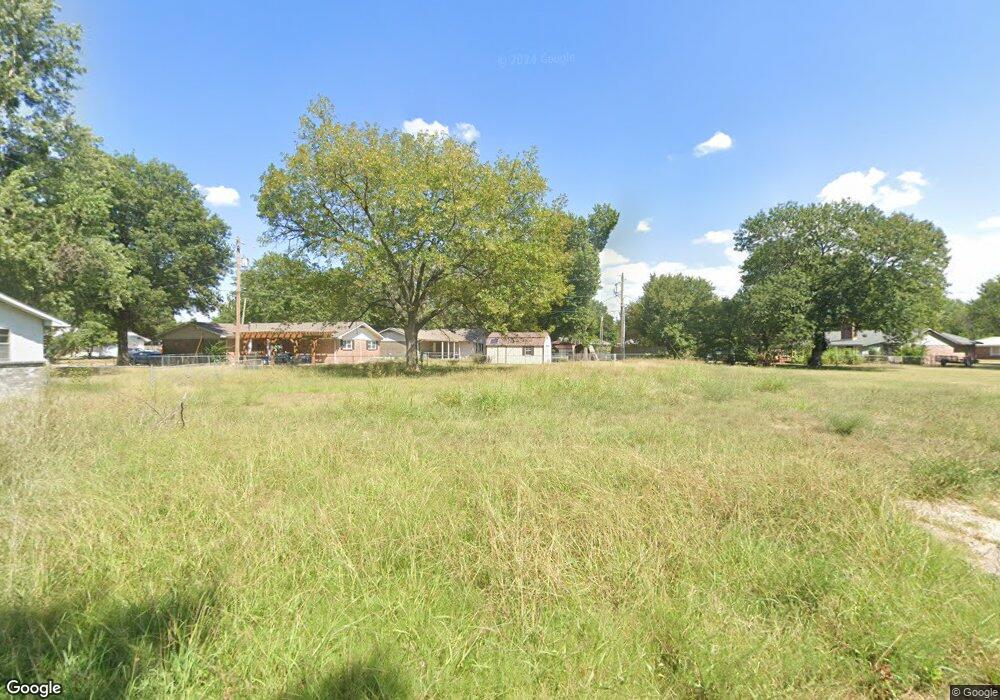
This home is located at 1512 Sky Harbor Dr, Miami, OK 74354 and is currently estimated at $115,879, approximately $69 per square foot. 1512 Sky Harbor Dr is a home located in Ottawa County with nearby schools including Miami High School and Mt. Olive Lutheran School.
Ownership History
Date
Name
Owned For
Owner Type
Purchase Details
Closed on
Jun 22, 2022
Sold by
Boutot David L and Boutot Teresa G
Bought by
City Of Miami
Current Estimated Value
Purchase Details
Closed on
Jan 21, 2009
Sold by
Buitot Teresa Gay and Buitot David L
Bought by
Boutot David L and Boutot Teresa G
Home Financials for this Owner
Home Financials are based on the most recent Mortgage that was taken out on this home.
Original Mortgage
$66,211
Interest Rate
5.09%
Mortgage Type
FHA
Purchase Details
Closed on
Jan 6, 2009
Sold by
Gleaves Troy Joseph and Gleaves Jeannie
Bought by
Boutot David L and Boutot Teresa G
Home Financials for this Owner
Home Financials are based on the most recent Mortgage that was taken out on this home.
Original Mortgage
$66,211
Interest Rate
5.09%
Mortgage Type
FHA
Purchase Details
Closed on
Nov 22, 2005
Sold by
Johnson Patricia June
Bought by
Gleaves Randall Allen and Gleaves Tiffany Renee
Create a Home Valuation Report for This Property
The Home Valuation Report is an in-depth analysis detailing your home's value as well as a comparison with similar homes in the area
Home Values in the Area
Average Home Value in this Area
Purchase History
| Date | Buyer | Sale Price | Title Company |
|---|---|---|---|
| City Of Miami | $101,000 | Ottawa County Abstract & Title | |
| Boutot David L | -- | None Available | |
| Boutot David L | -- | None Available | |
| Boutot David L | -- | None Available | |
| Boutot David L | -- | None Available | |
| Gleaves Randall Allen | -- | None Available |
Source: Public Records
Mortgage History
| Date | Status | Borrower | Loan Amount |
|---|---|---|---|
| Previous Owner | Boutot David L | $66,211 |
Source: Public Records
Tax History Compared to Growth
Tax History
| Year | Tax Paid | Tax Assessment Tax Assessment Total Assessment is a certain percentage of the fair market value that is determined by local assessors to be the total taxable value of land and additions on the property. | Land | Improvement |
|---|---|---|---|---|
| 2024 | -- | $0 | $0 | $0 |
| 2023 | $0 | $0 | $0 | $0 |
| 2022 | $478 | $6,176 | $510 | $5,666 |
| 2021 | $472 | $5,997 | $505 | $5,492 |
| 2020 | $459 | $5,822 | $500 | $5,322 |
| 2019 | $382 | $5,652 | $492 | $5,160 |
| 2018 | $371 | $5,488 | $485 | $5,003 |
| 2017 | $364 | $5,328 | $477 | $4,851 |
| 2016 | $335 | $5,173 | $470 | $4,703 |
| 2015 | $382 | $4,294 | $599 | $3,695 |
| 2014 | $329 | $5,022 | $456 | $4,566 |
Source: Public Records
Map
Nearby Homes
- 1611 Woodlawn Dr
- 1215 Sky Ln
- 1644 D St NE
- 1934 Birnamwood Dr
- 1803 Washington Dr
- 1839 D St NE
- 1821 C St NE
- 2101 Birnamwood Dr
- 411 E Bj Tunnell Blvd
- 1518 Lincoln Blvd
- 1815 N Grant Pkwy
- 624 G St NE
- 1525 N Main St
- 1916 S Grant Pkwy
- 1928 Cleveland Ave
- 601 G St NE
- 1916 A St NE
- 1300 Maple Dr
- 2003 E Rockdale Rd
- 718 N Elm St
- 1410 Sky Harbor Dr
- 1504 Sky Harbor Dr
- 1008 16th Ave NE
- 1424 13th St NE
- 1014 16th Ave NE
- 1405 Sky Harbor Dr
- 1415 Sky Harbor Dr
- 1009 16th Ave NE
- 1005 Sky Harbor Dr
- 1515 Sky Harbor Dr
- 1505 Sky Harbor Dr
- 1015 16th Ave NE
- 1020 16th Ave NE
- 1604 Sky Harbor Dr
- 1105 Scotty Ct
- 1015 Sky Harbor Dr
- 1310 13th Ave NE
- 1106 Scotty Ct
- 905 Sky Harbor Cir
- 1214 Charles George Ct