1512 Spring Ct Spring Grove, IL 60081
Estimated Value: $436,089 - $548,000
Studio
--
Bath
1,970
Sq Ft
$251/Sq Ft
Est. Value
About This Home
This home is located at 1512 Spring Ct, Spring Grove, IL 60081 and is currently estimated at $494,272, approximately $250 per square foot. 1512 Spring Ct is a home located in McHenry County with nearby schools including Spring Grove Elementary School, Nippersink Middle School, and Richmond-Burton High School.
Ownership History
Date
Name
Owned For
Owner Type
Purchase Details
Closed on
Sep 21, 2020
Sold by
Shea John M and Shea Terri L
Bought by
Shea John M and Shea Terri L
Current Estimated Value
Purchase Details
Closed on
Sep 1, 2018
Sold by
Kuna J Raymond
Bought by
Shea John M and Shea Terri L
Home Financials for this Owner
Home Financials are based on the most recent Mortgage that was taken out on this home.
Original Mortgage
$244,800
Outstanding Balance
$213,040
Interest Rate
4.5%
Mortgage Type
New Conventional
Estimated Equity
$281,232
Purchase Details
Closed on
Oct 7, 2010
Sold by
Kuna J Raymond and Kuna Felicia M
Bought by
Kuna J Raymond and J Raymond Kuna Declaration Of Trust
Purchase Details
Closed on
Dec 11, 1998
Sold by
J Moran Inc
Bought by
Kuna J Raymond and Kuna Felicia M
Purchase Details
Closed on
Mar 25, 1998
Sold by
Super Mix Inc Profit Sharing Plan
Bought by
J Moran Inc
Create a Home Valuation Report for This Property
The Home Valuation Report is an in-depth analysis detailing your home's value as well as a comparison with similar homes in the area
Home Values in the Area
Average Home Value in this Area
Purchase History
| Date | Buyer | Sale Price | Title Company |
|---|---|---|---|
| Shea John M | -- | None Available | |
| Shea John M | $306,000 | Heritage Title Co | |
| Kuna J Raymond | -- | None Available | |
| Kuna J Raymond | $40,000 | -- | |
| J Moran Inc | $40,000 | Norhtern Land Title Corp |
Source: Public Records
Mortgage History
| Date | Status | Borrower | Loan Amount |
|---|---|---|---|
| Open | Shea John M | $244,800 |
Source: Public Records
Tax History
| Year | Tax Paid | Tax Assessment Tax Assessment Total Assessment is a certain percentage of the fair market value that is determined by local assessors to be the total taxable value of land and additions on the property. | Land | Improvement |
|---|---|---|---|---|
| 2024 | $8,134 | $133,224 | $21,072 | $112,152 |
| 2023 | $8,042 | $124,253 | $19,653 | $104,600 |
| 2022 | $7,751 | $109,301 | $17,288 | $92,013 |
| 2021 | $7,340 | $103,036 | $16,297 | $86,739 |
| 2020 | $7,156 | $95,496 | $15,579 | $79,917 |
| 2019 | $7,202 | $94,011 | $15,337 | $78,674 |
| 2018 | $7,343 | $91,105 | $14,863 | $76,242 |
| 2017 | $7,216 | $85,552 | $13,957 | $71,595 |
| 2016 | $7,224 | $81,704 | $13,329 | $68,375 |
| 2013 | -- | $74,300 | $15,422 | $58,878 |
Source: Public Records
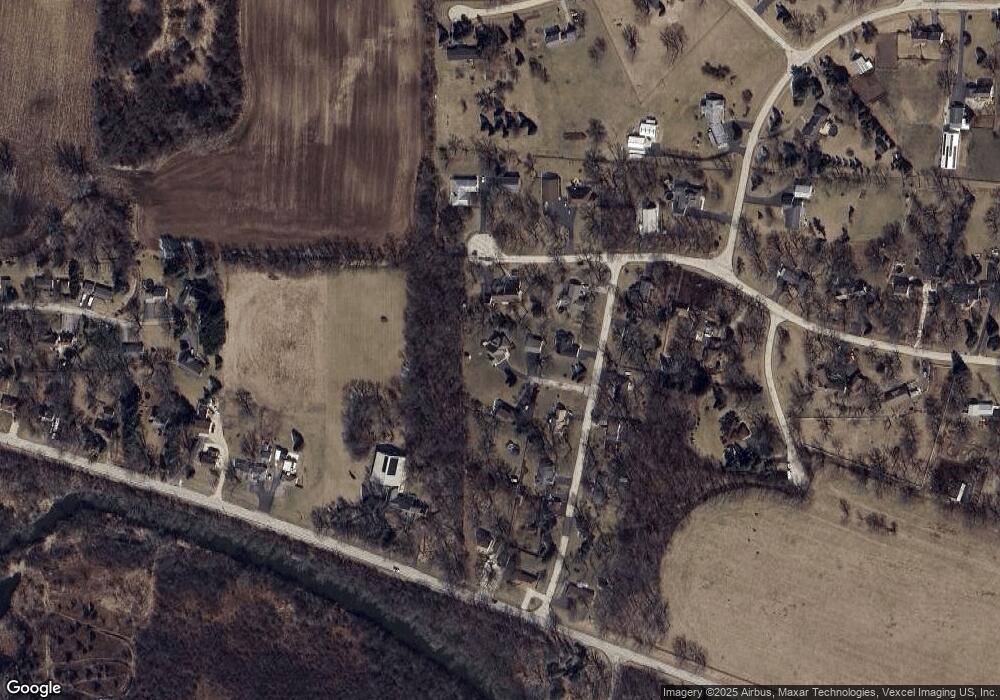
Map
Nearby Homes
- Lot 65,66,&64 Main Street Rd
- Lot 56 & 57 Beverly Way
- Lot 58 & 59 Beverly Way
- Lot 60 & 61 Beverly Way
- LOT 9 Mayo Ct
- 1410 Linden Rd
- 2214 Main Street Rd
- 1876 Red Oak Ln
- 1992 Red Oak Ln
- Lot 36 Red Oak Ln
- 1852 Red Oak Ln
- 1975 Red Oak Ln
- 1979 Red Oak Ln
- 1848 Red Oak Ln
- 1971 Red Oak Ln
- 7388 English Oak Ln
- 7393 English Oak Ln
- 8501 Country Shire Ln
- 7389 English Oak Ln
- 2003 Red Oak Ln
- 1511 Spring Ct
- 8007 Bellvue Ave
- 8005 Bellvue Ave
- 8009 Bellevue Ave
- 8009 Bellvue Ave
- 7917 Bellvue Ave
- 8006 Bellvue Ave
- 8008 Bellvue Ave
- 7950 Bellvue Ave
- 8010 Bellvue Ave
- 1612 Main Street Rd
- 1422 Berwyn St
- 1422 Berwyn St
- 1412 Berwyn St
- 1412 Berwyn St
- 7907 Bellvue Ave
- 7920 Bellvue Ave
- 1604 Main Street Rd
- 1407 Berwyn St
- 1520 Main Street Rd
Your Personal Tour Guide
Ask me questions while you tour the home.