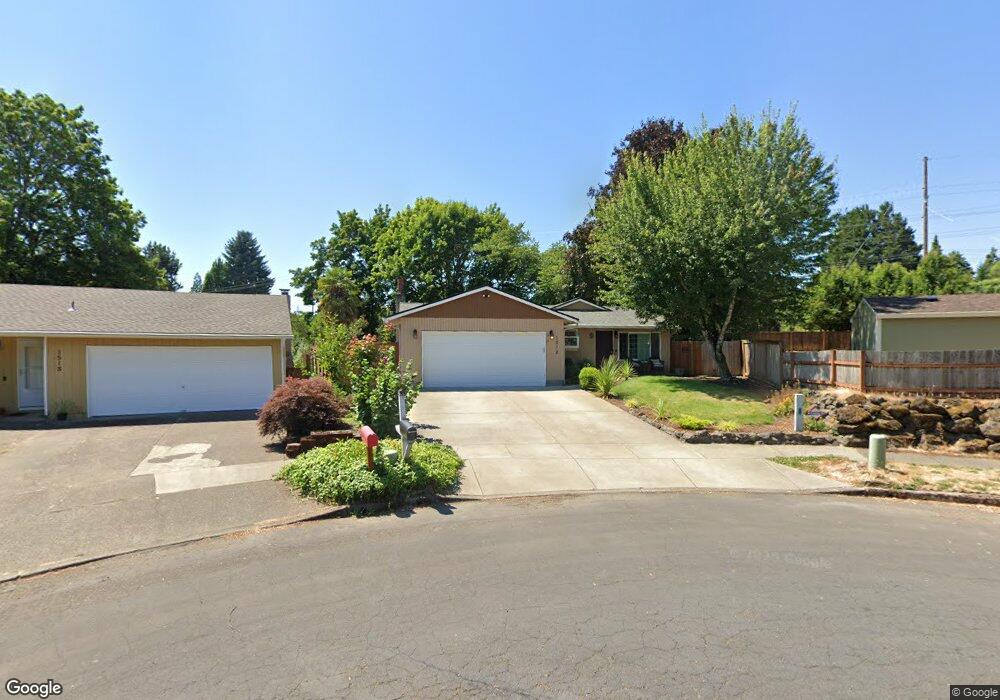
1512 Spring Garden Way Forest Grove, OR 97116
Estimated Value: $460,959 - $516,000
3
Beds
2
Baths
1,288
Sq Ft
$379/Sq Ft
Est. Value
About This Home
This home is located at 1512 Spring Garden Way, Forest Grove, OR 97116 and is currently estimated at $488,740, approximately $379 per square foot. 1512 Spring Garden Way is a home located in Washington County with nearby schools including Harvey Clarke Elementary School, Tom McCall Upper Elementary School, and Neil Armstrong Middle School.
Ownership History
Date
Name
Owned For
Owner Type
Purchase Details
Closed on
May 30, 2002
Sold by
Tulberg Marvin Dale and Tulberg Lee A
Bought by
Pubill Raul E and Pubill Laura O
Current Estimated Value
Home Financials for this Owner
Home Financials are based on the most recent Mortgage that was taken out on this home.
Original Mortgage
$149,553
Outstanding Balance
$62,351
Interest Rate
6.89%
Mortgage Type
FHA
Estimated Equity
$426,389
Purchase Details
Closed on
Dec 5, 1996
Sold by
Farber Scott D and Farber Leslie S
Bought by
Tulberg Marvin Dale and Tulberg Lee A
Home Financials for this Owner
Home Financials are based on the most recent Mortgage that was taken out on this home.
Original Mortgage
$120,000
Interest Rate
7.86%
Purchase Details
Closed on
Oct 18, 1995
Sold by
Winslow Kirstin Ann and Winslow Scott Byron
Bought by
Farber Scott D and Farber Leslie S
Create a Home Valuation Report for This Property
The Home Valuation Report is an in-depth analysis detailing your home's value as well as a comparison with similar homes in the area
Home Values in the Area
Average Home Value in this Area
Purchase History
| Date | Buyer | Sale Price | Title Company |
|---|---|---|---|
| Pubill Raul E | $151,900 | First American Title Ins Co | |
| Tulberg Marvin Dale | $129,900 | Oregon Title Insurance Co | |
| Farber Scott D | $119,000 | Ticor Title |
Source: Public Records
Mortgage History
| Date | Status | Borrower | Loan Amount |
|---|---|---|---|
| Open | Pubill Raul E | $149,553 | |
| Previous Owner | Tulberg Marvin Dale | $120,000 |
Source: Public Records
Tax History Compared to Growth
Tax History
| Year | Tax Paid | Tax Assessment Tax Assessment Total Assessment is a certain percentage of the fair market value that is determined by local assessors to be the total taxable value of land and additions on the property. | Land | Improvement |
|---|---|---|---|---|
| 2026 | $3,801 | $213,460 | -- | -- |
| 2025 | $3,801 | $207,250 | -- | -- |
| 2024 | $3,667 | $201,220 | -- | -- |
| 2023 | $3,667 | $195,360 | $0 | $0 |
| 2022 | $3,207 | $195,360 | $0 | $0 |
| 2021 | $3,165 | $184,150 | $0 | $0 |
| 2020 | $3,148 | $178,790 | $0 | $0 |
| 2019 | $3,078 | $173,590 | $0 | $0 |
| 2018 | $2,984 | $168,540 | $0 | $0 |
| 2017 | $2,891 | $163,640 | $0 | $0 |
| 2016 | $2,810 | $158,880 | $0 | $0 |
| 2015 | $2,702 | $154,260 | $0 | $0 |
| 2014 | $2,689 | $149,770 | $0 | $0 |
Source: Public Records
Map
Nearby Homes
- 1609 Camino Dr
- 1611 Camino Dr
- 1425 Willamina Ave
- 1315 Begonia Ave
- 2341 Turnbull Ct
- 2327 Turnbull Ct
- 1222 Brookside Ave
- 1104 Magnolia Way
- 1718 23rd Ave
- 1224 Alyssum Ave
- 2517 Sweetwood Ct
- 1078 Vista Oaks Dr
- 2108 D St
- 2119 B St
- 2440 Heather Way
- 0 C St Unit Lot 1
- 0 C St Unit 24232816
- 2106 Charlie Ct
- 1931 D St
- 922 Rosebud Ct
- 1518 Spring Garden Way
- 1520 Spring Garden Way
- 1439 Rosearden Dr
- 1519 Spring Garden Way
- 1515 Spring Garden Way
- 1501 Spring Garden Way
- 1429 Rosearden Dr
- 1509 Spring Garden Way
- 1510 Somera Dr
- 1507 Spring Garden Way
- 1512 Somera Dr
- 1431 Spring Garden Way
- 1521 Spring Garden Way
- 1421 Rosearden Dr
- 1505 Spring Garden Way
- 1508 Somera Dr
- 1430 Spring Garden Way
- 1444 Rosearden Dr
- 1619 Camino Dr
- 1506 Somera Dr