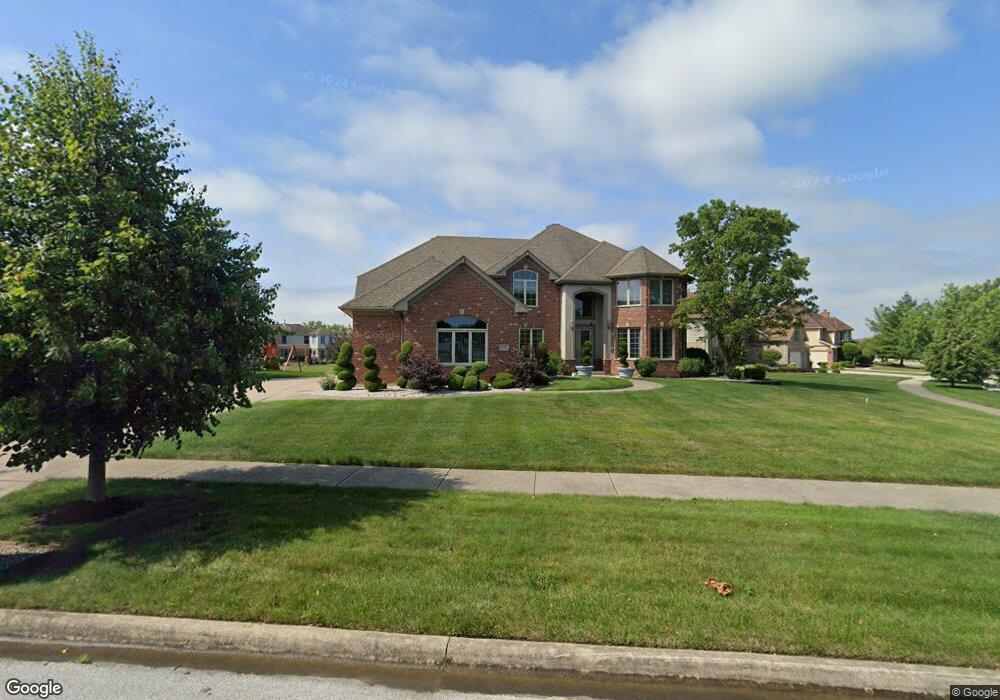
1512 Tiree Ct Flossmoor, IL 60422
Estimated Value: $583,347 - $680,000
4
Beds
5
Baths
4,100
Sq Ft
$158/Sq Ft
Est. Value
About This Home
This home is located at 1512 Tiree Ct, Flossmoor, IL 60422 and is currently estimated at $647,587, approximately $157 per square foot. 1512 Tiree Ct is a home located in Cook County with nearby schools including Flossmoor Hills Elementary School, Parker Junior High School, and Homewood-Flossmoor High School.
Ownership History
Date
Name
Owned For
Owner Type
Purchase Details
Closed on
Oct 14, 2021
Sold by
Scott Thelma
Bought by
Chicago Title Land Trust Company and Trust Number 8006387269
Current Estimated Value
Purchase Details
Closed on
Aug 8, 2011
Sold by
Adeoye Martins and Adeoye Lashaun T
Bought by
Scott Leo and Scott Thelma
Purchase Details
Closed on
Apr 27, 2010
Sold by
Graves Lashawnda and Adeoye Lashwanda
Bought by
Adeoye Martins
Purchase Details
Closed on
May 13, 2005
Sold by
Graves Lashawnda
Bought by
Adeoye Martin and Graves Lashawnda
Purchase Details
Closed on
Jul 23, 2004
Sold by
First Midwest Bank
Bought by
Graves Lashawnda
Home Financials for this Owner
Home Financials are based on the most recent Mortgage that was taken out on this home.
Original Mortgage
$447,920
Interest Rate
6.37%
Mortgage Type
Purchase Money Mortgage
Create a Home Valuation Report for This Property
The Home Valuation Report is an in-depth analysis detailing your home's value as well as a comparison with similar homes in the area
Home Values in the Area
Average Home Value in this Area
Purchase History
| Date | Buyer | Sale Price | Title Company |
|---|---|---|---|
| Chicago Title Land Trust Company | -- | Chicago Title | |
| Scott Leo | $350,000 | None Available | |
| Adeoye Martins | -- | None Available | |
| Adeoye Martin | -- | -- | |
| Graves Lashawnda | $560,000 | Cti |
Source: Public Records
Mortgage History
| Date | Status | Borrower | Loan Amount |
|---|---|---|---|
| Previous Owner | Graves Lashawnda | $447,920 | |
| Closed | Graves Lashawnda | $111,980 |
Source: Public Records
Tax History Compared to Growth
Tax History
| Year | Tax Paid | Tax Assessment Tax Assessment Total Assessment is a certain percentage of the fair market value that is determined by local assessors to be the total taxable value of land and additions on the property. | Land | Improvement |
|---|---|---|---|---|
| 2024 | $18,292 | $50,000 | $12,121 | $37,879 |
| 2023 | $18,292 | $50,000 | $12,121 | $37,879 |
| 2022 | $18,292 | $37,428 | $10,468 | $26,960 |
| 2021 | $15,792 | $37,428 | $10,468 | $26,960 |
| 2020 | $15,792 | $37,428 | $10,468 | $26,960 |
| 2019 | $15,792 | $37,088 | $9,366 | $27,722 |
| 2018 | $0 | $37,088 | $9,366 | $27,722 |
| 2017 | $15,792 | $37,088 | $9,366 | $27,722 |
| 2016 | $15,833 | $32,392 | $8,264 | $24,128 |
| 2015 | $15,842 | $32,392 | $8,264 | $24,128 |
| 2014 | $16,912 | $32,392 | $8,264 | $24,128 |
| 2013 | $11,558 | $28,698 | $8,264 | $20,434 |
Source: Public Records
Map
Nearby Homes
- 3907 Troon St
- 19407 Oak Ave Unit 76
- 3845 192nd St
- 19361 Oak Ave Unit 3
- 4105 195th St Unit 70D
- 19338 Oak Ave Unit 23
- 3521 Park Place
- 19435 Hickory Place Unit 29A
- 4008 192nd Place
- 3427 Vollmer Rd Unit 209
- 19423 Hickory Place Unit 31D
- 19937 Burnside Ct
- 3949 Flossmoor Rd
- 4122 193rd St Unit 258
- 3415 Vollmer Rd Unit 308
- 20001 Arquilla Cir
- 19221 Elm Dr Unit 150
- 1433 Woodhollow Dr
- 3533 Flossmoor Rd
- 4128 192nd Ct Unit 221
- 3736 Ballantrae Way
- 1524 Tiree Ct
- 3740 Ballantrae Way
- 1532 Tiree Ct
- 3737 Ballantrae Way
- 3732 Ballantrae Way
- 3721 Culloden St
- 3725 Culloden St
- 3731 Ballantrae Way
- 3717 Culloden St
- 1527 Tiree Ct
- 1543 Tiree Ct
- 3729 Culloden St
- 1539 Tiree Ct
- 3711 Culloden St
- 3733 Culloden St
- 1507 Kinross St
- 3726 Ballantrae Way
- 3709 Culloden St