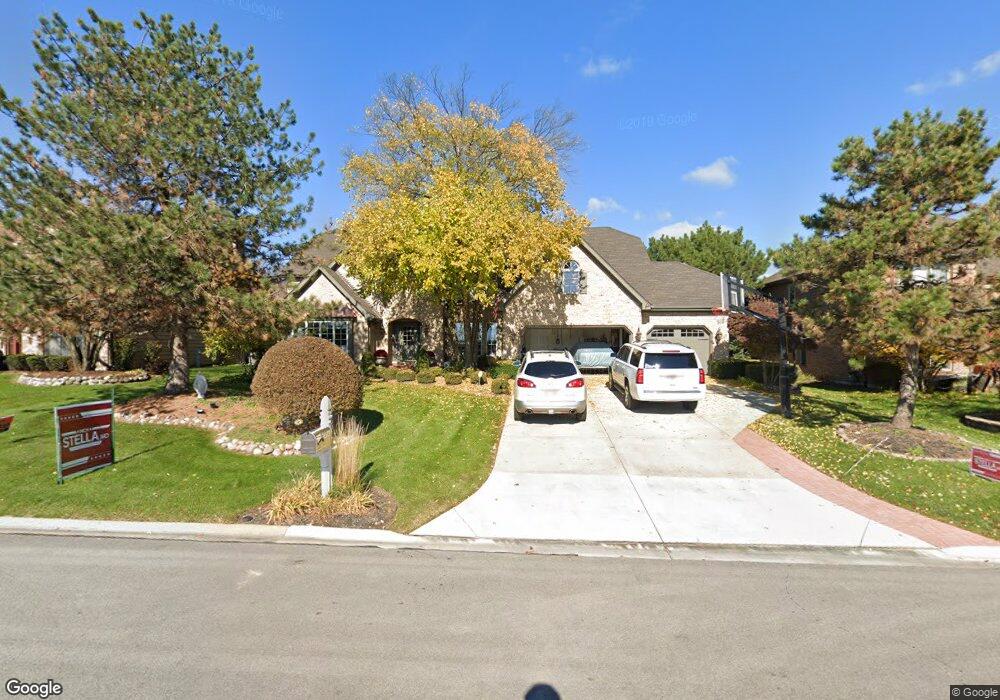
1512 Willow Creek Ln Darien, IL 60561
Estimated Value: $845,000 - $904,000
--
Bed
--
Bath
3,511
Sq Ft
$248/Sq Ft
Est. Value
About This Home
This home is located at 1512 Willow Creek Ln, Darien, IL 60561 and is currently estimated at $868,978, approximately $247 per square foot. 1512 Willow Creek Ln is a home located in DuPage County with nearby schools including Concord Elementary School, Cass Jr High School, and Hinsdale South High School.
Ownership History
Date
Name
Owned For
Owner Type
Purchase Details
Closed on
Sep 13, 2024
Sold by
Bland Robert S and Bland Maureen A
Bought by
Robert S Bland Trust and Bland
Current Estimated Value
Purchase Details
Closed on
Sep 26, 2001
Sold by
Mungo Raymond and Mungo Nanette
Bought by
Bland Robert S and Bland Maureen A
Home Financials for this Owner
Home Financials are based on the most recent Mortgage that was taken out on this home.
Original Mortgage
$570,000
Interest Rate
4.42%
Purchase Details
Closed on
Jun 14, 1996
Sold by
Schwed Alan J and Schwed Pamela L
Bought by
Mungo Raymond
Home Financials for this Owner
Home Financials are based on the most recent Mortgage that was taken out on this home.
Original Mortgage
$150,000
Interest Rate
8.05%
Create a Home Valuation Report for This Property
The Home Valuation Report is an in-depth analysis detailing your home's value as well as a comparison with similar homes in the area
Home Values in the Area
Average Home Value in this Area
Purchase History
| Date | Buyer | Sale Price | Title Company |
|---|---|---|---|
| Robert S Bland Trust | -- | None Listed On Document | |
| Bland Robert S | $650,000 | -- | |
| Mungo Raymond | $500,000 | -- |
Source: Public Records
Mortgage History
| Date | Status | Borrower | Loan Amount |
|---|---|---|---|
| Previous Owner | Bland Robert S | $570,000 | |
| Previous Owner | Mungo Raymond | $150,000 |
Source: Public Records
Tax History Compared to Growth
Tax History
| Year | Tax Paid | Tax Assessment Tax Assessment Total Assessment is a certain percentage of the fair market value that is determined by local assessors to be the total taxable value of land and additions on the property. | Land | Improvement |
|---|---|---|---|---|
| 2024 | $15,433 | $247,464 | $77,528 | $169,936 |
| 2023 | $14,832 | $227,490 | $71,270 | $156,220 |
| 2022 | $14,049 | $216,430 | $67,800 | $148,630 |
| 2021 | $13,043 | $213,970 | $67,030 | $146,940 |
| 2020 | $12,816 | $209,730 | $65,700 | $144,030 |
| 2019 | $12,332 | $201,240 | $63,040 | $138,200 |
| 2018 | $12,156 | $202,520 | $62,760 | $139,760 |
| 2017 | $11,881 | $194,880 | $60,390 | $134,490 |
| 2016 | $12,943 | $206,640 | $64,030 | $142,610 |
| 2015 | $12,703 | $194,410 | $60,240 | $134,170 |
| 2014 | $13,074 | $197,350 | $58,570 | $138,780 |
| 2013 | $13,396 | $208,420 | $58,300 | $150,120 |
Source: Public Records
Map
Nearby Homes
- 1390 Marco Ct
- 1370 Marco Ct
- 8408 Dawn Ln
- 7930 Grant St
- 1018 Bob-O-link Ln
- 8122 Ripple Ridge
- 8291 Ripple Ridge
- 8511 Kearney Rd
- 7833 Darien Lake Dr
- 7829 Darien Lake Dr
- 1501 Darien Lake Dr Unit 305
- 9S211 Graceland St
- 7801 Pine Pkwy
- 8826 Carlisle Ct
- 500 Redondo Dr Unit 409
- 500 Redondo Dr Unit 308
- 17W455 Concord Place
- 502 Redondo Dr Unit 503
- 8100 Woodglen Ln Unit 204
- 9S115 Nantucket Dr
- 1516 Willow Creek Ln
- 1508 Willow Creek Ln
- 1520 Willow Creek Ln
- 1504 Willow Creek Ln
- 1513 Winterberry Ln
- 1509 Winterberry Ln
- 1524 Willow Creek Ln
- 1521 Winterberry Ln
- 1505 Winterberry Ln
- 1500 Willow Creek Ln
- 1525 Winterberry Ln
- 1528 Willow Creek Ln Unit 3
- 1508 Winterberry Ln
- 1512 Winterberry Ln
- 1516 Winterberry Ln
- 1529 Winterberry Ln
- 1532 Willow Creek Ln
- 1504 Winterberry Ln Unit 3
- 1524 Winterberry Ln