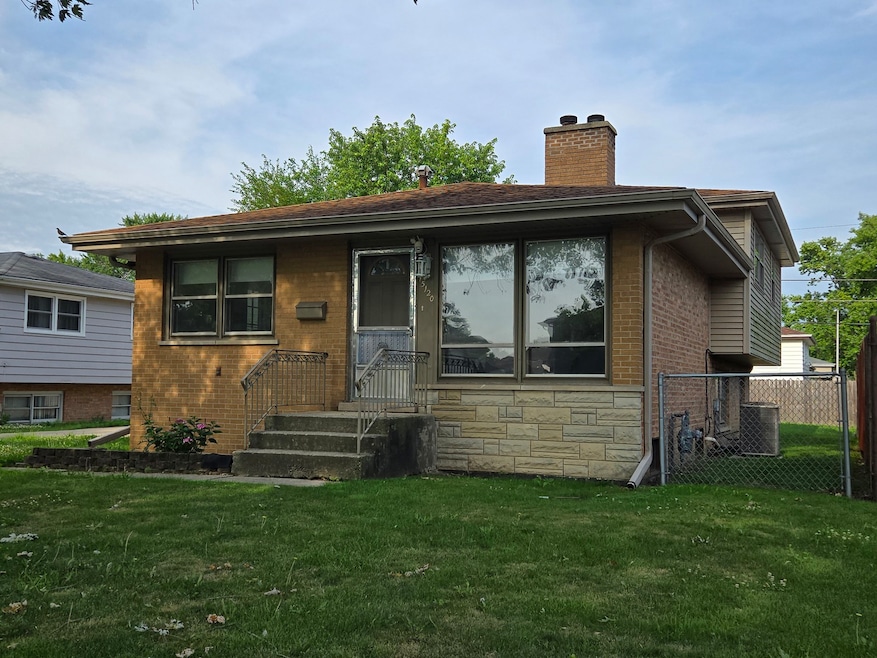
15120 Hamlin Ave Midlothian, IL 60445
Estimated payment $1,789/month
Highlights
- Wood Burning Stove
- Prairie Architecture
- Laundry Room
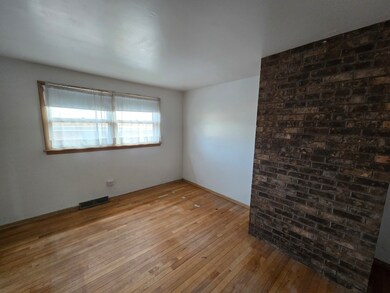
- Wood Flooring
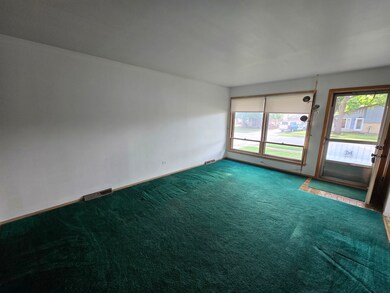
- Living Room
- Forced Air Heating and Cooling System
About This Home
NOW IS YOUR CHANCE TO OWN THE ONE AND ONLY QUAD-LEVEL HOME IN JOLLY HOMES.THIS ALL-BRICK SPLIT LEVEL OFFERS YOUR CHOICE OF HEATING. CHOOSE THE CONVENTIONAL FORCED AIR GAS FURNACE OR SAVE ON FUEL COSTS WITH AN ACTUAL WOOD BURNING FURNACE. NOT TO MENTION THE CUSTOM WOOD BURNING STOVE IN THE FAMILY ROOM. ALL APPLIANCES STAY WITH THE HOME. OVERSIZED ALL BRICK GARAGE. DRIVEWAY IS OVERSIZED FOR GREAT ENTERTAINMENT NEEDS, AND THERE IS EVEN A SIDE PARKING SPACE, PERFECT FOR A BOAT OR CAMPER!
Home Details
Home Type
- Single Family
Est. Annual Taxes
- $5,936
Lot Details
- Lot Dimensions are 59 x 107
- Paved or Partially Paved Lot
Parking
- 2 Car Garage
- Parking Included in Price
Home Design
- Prairie Architecture
- Split Level with Sub
- Quad-Level Property
- Brick Exterior Construction
- Asphalt Roof
Interior Spaces
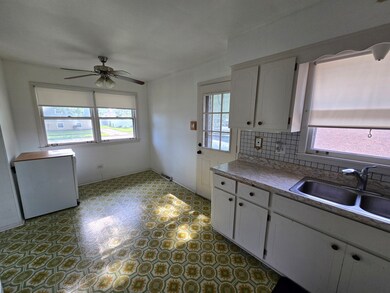
- Ceiling Fan
- Wood Burning Stove
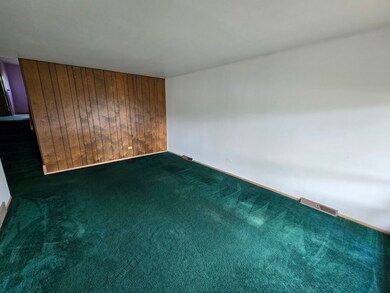
- Family Room with Fireplace
- Living Room
- Dining Room
- Partial Basement
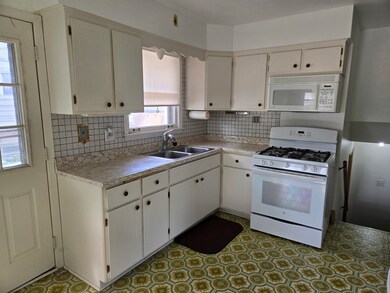
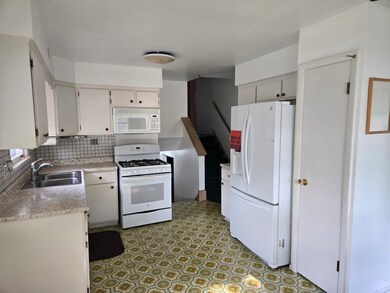
Kitchen
- Range
- Microwave
Flooring
- Wood
- Carpet
- Vinyl
Bedrooms and Bathrooms
- 3 Bedrooms
- 3 Potential Bedrooms
- 2 Full Bathrooms
Laundry
- Laundry Room
- Dryer
- Washer
Schools
- Bremen High School
Utilities
- Forced Air Heating and Cooling System
- Heating System Uses Natural Gas
- 100 Amp Service
- Lake Michigan Water
Community Details
- Jolly Homes Subdivision, Quad Floorplan
Listing and Financial Details
- Senior Tax Exemptions
- Homeowner Tax Exemptions
Map
Home Values in the Area
Average Home Value in this Area
Tax History
| Year | Tax Paid | Tax Assessment Tax Assessment Total Assessment is a certain percentage of the fair market value that is determined by local assessors to be the total taxable value of land and additions on the property. | Land | Improvement |
|---|---|---|---|---|
| 2024 | $5,936 | $19,000 | $2,683 | $16,317 |
| 2023 | $5,355 | $19,000 | $2,683 | $16,317 |
| 2022 | $5,355 | $14,819 | $2,367 | $12,452 |
| 2021 | $5,189 | $14,818 | $2,367 | $12,451 |
| 2020 | $5,040 | $14,818 | $2,367 | $12,451 |
| 2019 | $4,668 | $14,176 | $2,209 | $11,967 |
| 2018 | $6,060 | $14,176 | $2,209 | $11,967 |
| 2017 | $5,840 | $14,176 | $2,209 | $11,967 |
| 2016 | $5,296 | $12,343 | $1,893 | $10,450 |
| 2015 | $5,178 | $12,343 | $1,893 | $10,450 |
| 2014 | $5,025 | $12,343 | $1,893 | $10,450 |
| 2013 | $5,044 | $13,787 | $1,893 | $11,894 |
Property History
| Date | Event | Price | List to Sale | Price per Sq Ft |
|---|---|---|---|---|
| 11/22/2025 11/22/25 | For Sale | $245,000 | 0.0% | -- |
| 09/09/2025 09/09/25 | Pending | -- | -- | -- |
| 09/03/2025 09/03/25 | Price Changed | $245,000 | -3.9% | -- |
| 08/25/2025 08/25/25 | Price Changed | $254,900 | -1.9% | -- |
| 08/04/2025 08/04/25 | Price Changed | $259,900 | -1.9% | -- |
| 07/19/2025 07/19/25 | For Sale | $265,000 | -- | -- |
Purchase History
| Date | Type | Sale Price | Title Company |
|---|---|---|---|
| Interfamily Deed Transfer | -- | Carrington Title Partners Ll | |
| Warranty Deed | $140,000 | Pntn | |
| Interfamily Deed Transfer | -- | First American Title Ins Co | |
| Interfamily Deed Transfer | -- | First American Title Ins Co |
Mortgage History
| Date | Status | Loan Amount | Loan Type |
|---|---|---|---|
| Open | $136,451 | FHA |
Source: Midwest Real Estate Data (MRED)
MLS Number: 12425442
APN: 28-14-115-006-0000
Disclaimer: Certain information contained herein is derived from information provided by parties other than Homes.com. All information provided is deemed reliable, but is not guaranteed to be accurate and should be independently verified.
![]() Based on information submitted to the MLS GRID. All data is obtained from various sources and may not have been verified by broker or MLS GRID. Supplied Open House Information is subject to change without notice. All information should be independently reviewed and verified for accuracy. Properties may or may not be listed by the office/agent presenting the information. Some IDX listings have been excluded from this website.
Based on information submitted to the MLS GRID. All data is obtained from various sources and may not have been verified by broker or MLS GRID. Supplied Open House Information is subject to change without notice. All information should be independently reviewed and verified for accuracy. Properties may or may not be listed by the office/agent presenting the information. Some IDX listings have been excluded from this website.
The Digital Millennium Copyright Act of 1998, 17 U.S.C. § 512 (the “DMCA”) provides recourse for copyright owners who believe that material appearing on the Internet infringes their rights under U.S. copyright law. If you believe in good faith that any content or material made available in connection with our website or services infringes your copyright, you (or your agent) may send us a notice requesting that the content or material be removed, or access to it blocked.
Notices must be sent in writing by email to DMCAnotice@MLSGrid.com.
The DMCA requires that your notice of alleged copyright infringement include the following information:
(1) description of the copyrighted work that is the subject of claimed infringement;
(2) description of the alleged infringing content and information sufficient to permit us to locate the content;
(3) contact information for you, including your address, telephone number and email address;
(4) a statement by you that you have a good faith belief that the content in the manner complained of is not authorized by the copyright owner, or its agent, or by the operation of any law;
(5) a statement by you, signed under penalty of perjury, that the information in the notification is accurate and that you have the authority to enforce the copyrights that are claimed to be infringed; and
(6) a physical or electronic signature of the copyright owner or a person authorized to act on the copyright owner’s behalf. Failure to include all of the above information may result in the delay of the processing of your complaint.
- 15100 Avers Ave
- 15115 Springfield Ave
- 15215 Hamlin Ave
- 15031 Hamlin Ave
- 15053 Lawndale Ave
- 15035 Harding Ave
- 3624 151st St
- 15235 Lawndale Ave
- 14944 Springfield Ave
- 14914 Avers Ave
- 14969 Willow Crest Unit 17
- 3740 153rd St
- 14970 Pulaski Rd Unit 5
- 3732 153rd St
- 3846 149th St
- 15303 Birch Rd
- 14839 Lawndale Ave
- 14903 Terrace Ln
- 15330 Cherry Ln
- 3831 W 154th St
- 14558 Turner Ave
- 15407 Kenton Ave
- 14325 Karlov Ave
- 3118 W 145th St
- 14448 Kilbourn Ave
- 3235 W 157th St
- 3824 Sunset Ave
- 4800 157th St
- 14631 Lamon Ave Unit 2-N
- 3011 140th Place
- 4905 143rd Place
- 16508 Brockton Ln
- 16142 Grove Ave
- 15515 Long Ave
- 14139 S Western Ave
- 14700 Central Ave
- 2823 Broadway St
- 3951 171st St
- 5144 Oakwood Ct
- 15447 David Ln
