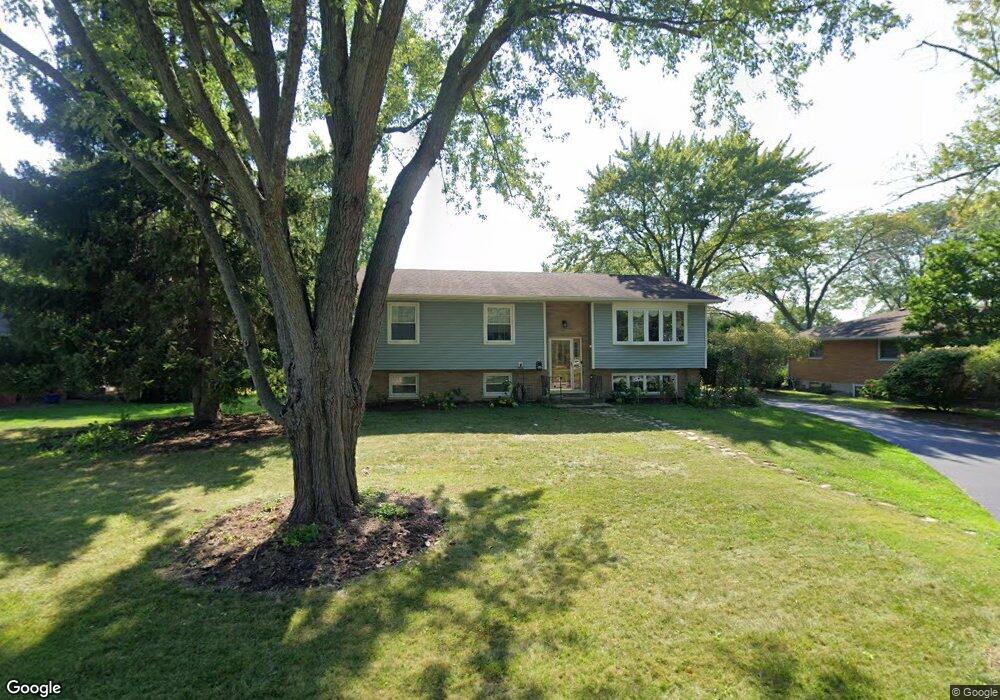
15121 W Clover Ln Libertyville, IL 60048
Estimated Value: $415,780 - $567,000
3
Beds
2
Baths
1,220
Sq Ft
$413/Sq Ft
Est. Value
About This Home
This home is located at 15121 W Clover Ln, Libertyville, IL 60048 and is currently estimated at $503,945, approximately $413 per square foot. 15121 W Clover Ln is a home located in Lake County with nearby schools including Oak Grove Elementary School, Libertyville High School, and St Joseph Catholic School.
Ownership History
Date
Name
Owned For
Owner Type
Purchase Details
Closed on
Apr 8, 2004
Sold by
Johnson Jack and Meyn Michael
Bought by
Feldman Jill M
Current Estimated Value
Home Financials for this Owner
Home Financials are based on the most recent Mortgage that was taken out on this home.
Original Mortgage
$214,400
Outstanding Balance
$99,626
Interest Rate
5.48%
Mortgage Type
Purchase Money Mortgage
Estimated Equity
$404,319
Purchase Details
Closed on
Sep 9, 2003
Sold by
Nicolini Claudio F and Brennan Maureen
Bought by
Johnson Jack and Meyn Michael
Purchase Details
Closed on
Aug 5, 1997
Sold by
Trost Thomas L and Trost Barbara A
Bought by
Nicolini Claudio F and Brennan Maureen
Home Financials for this Owner
Home Financials are based on the most recent Mortgage that was taken out on this home.
Original Mortgage
$145,600
Interest Rate
7.12%
Create a Home Valuation Report for This Property
The Home Valuation Report is an in-depth analysis detailing your home's value as well as a comparison with similar homes in the area
Home Values in the Area
Average Home Value in this Area
Purchase History
| Date | Buyer | Sale Price | Title Company |
|---|---|---|---|
| Feldman Jill M | $268,000 | Chicago Title Insurance Co | |
| Johnson Jack | $228,000 | -- | |
| Nicolini Claudio F | $121,333 | -- |
Source: Public Records
Mortgage History
| Date | Status | Borrower | Loan Amount |
|---|---|---|---|
| Open | Feldman Jill M | $214,400 | |
| Previous Owner | Nicolini Claudio F | $145,600 | |
| Closed | Feldman Jill M | $26,800 |
Source: Public Records
Tax History Compared to Growth
Tax History
| Year | Tax Paid | Tax Assessment Tax Assessment Total Assessment is a certain percentage of the fair market value that is determined by local assessors to be the total taxable value of land and additions on the property. | Land | Improvement |
|---|---|---|---|---|
| 2024 | $9,322 | $139,270 | $59,498 | $79,772 |
| 2023 | $8,854 | $128,454 | $54,877 | $73,577 |
| 2022 | $8,854 | $121,449 | $52,745 | $68,704 |
| 2021 | $8,509 | $118,835 | $51,610 | $67,225 |
| 2020 | $8,192 | $116,837 | $50,742 | $66,095 |
| 2019 | $7,985 | $115,727 | $50,260 | $65,467 |
| 2018 | $7,948 | $119,614 | $50,308 | $69,306 |
| 2017 | $7,821 | $115,838 | $48,720 | $67,118 |
| 2016 | $7,478 | $109,830 | $46,193 | $63,637 |
| 2015 | $7,338 | $102,654 | $43,175 | $59,479 |
| 2014 | $6,939 | $96,453 | $40,567 | $55,886 |
| 2012 | $6,744 | $98,060 | $40,920 | $57,140 |
Source: Public Records
Map
Nearby Homes
- 15040 W Clover Ln
- 30408 N Oak Grove Ave
- 1545 Steeplechase Ct
- 1768 White Fence Ln
- 921 Guerin Rd
- 15734 W Buckley Rd
- 1270 Benson Ln
- 1625 Churchill Ct
- 16051 W Des Plaines Dr
- 2061 Buckley Rd
- 16108 W Des Plaines Dr
- 31366 W Somerset Cir
- 15393 W Oak Spring Rd
- 14875 Creekside Path
- 14572 N Somerset Cir
- 5420 Belmont Ct
- 31132-31140 N Milwaukee Ave
- 1211 Parliament Ct
- 224 Newberry Ave
- 28951 N Forest Lake Ln
- 15105 W Clover Ln
- 15137 W Clover Ln
- 15170 W Redwood Ln Unit 5
- 15089 W Clover Ln
- 15149 W Clover Ln Unit 5
- 15158 W Redwood Ln
- 15182 W Redwood Ln
- 15100 W Clover Ln
- 15146 W Redwood Ln Unit 5
- 15118 W Clover Ln Unit 5
- 15075 W Clover Ln
- 15056 W Clover Ln
- 15175 W Clover Ln
- 15122 W Redwood Ln
- 15208 W Redwood Ln
- 15090 W Clover Ln
- 15136 W Clover Ln
- 15057 W Clover Ln
- 15100 W Redwood Ln Unit 5
- 15050 W Clover Ln