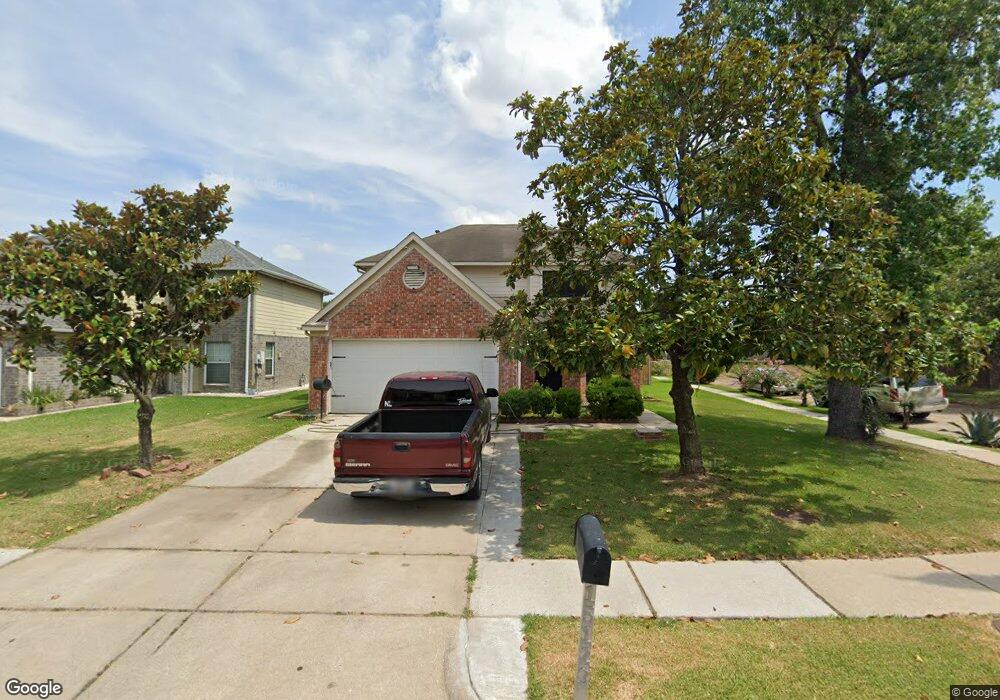
15123 Elstree Dr Channelview, TX 77530
Estimated Value: $270,441 - $290,000
4
Beds
3
Baths
2,385
Sq Ft
$117/Sq Ft
Est. Value
About This Home
This home is located at 15123 Elstree Dr, Channelview, TX 77530 and is currently estimated at $277,860, approximately $116 per square foot. 15123 Elstree Dr is a home located in Harris County with nearby schools including Channelview High School, Family Christian Academy, and Creative Corner.
Ownership History
Date
Name
Owned For
Owner Type
Purchase Details
Closed on
Jan 28, 2008
Sold by
Nguyen Chau Ngoc and Thai Don Thi
Bought by
Resendez Jose Francisco
Current Estimated Value
Home Financials for this Owner
Home Financials are based on the most recent Mortgage that was taken out on this home.
Original Mortgage
$117,855
Outstanding Balance
$74,689
Interest Rate
6.15%
Mortgage Type
Purchase Money Mortgage
Estimated Equity
$203,171
Purchase Details
Closed on
Oct 11, 2004
Sold by
Nguyen Cody and Nguyen Cuong Thai
Bought by
Nguyen Chau Ngoc and Thai Don Thi
Purchase Details
Closed on
May 14, 1998
Sold by
Long Lake Llc
Bought by
Nguyen Cuong Thai
Home Financials for this Owner
Home Financials are based on the most recent Mortgage that was taken out on this home.
Original Mortgage
$78,800
Interest Rate
7.22%
Create a Home Valuation Report for This Property
The Home Valuation Report is an in-depth analysis detailing your home's value as well as a comparison with similar homes in the area
Home Values in the Area
Average Home Value in this Area
Purchase History
| Date | Buyer | Sale Price | Title Company |
|---|---|---|---|
| Resendez Jose Francisco | -- | Chicago Title | |
| Nguyen Chau Ngoc | -- | -- | |
| Nguyen Cuong Thai | -- | American Title Co |
Source: Public Records
Mortgage History
| Date | Status | Borrower | Loan Amount |
|---|---|---|---|
| Open | Resendez Jose Francisco | $117,855 | |
| Previous Owner | Nguyen Cuong Thai | $78,800 |
Source: Public Records
Tax History Compared to Growth
Tax History
| Year | Tax Paid | Tax Assessment Tax Assessment Total Assessment is a certain percentage of the fair market value that is determined by local assessors to be the total taxable value of land and additions on the property. | Land | Improvement |
|---|---|---|---|---|
| 2025 | $5,565 | $281,545 | $32,681 | $248,864 |
| 2024 | $5,565 | $272,280 | $32,681 | $239,599 |
| 2023 | $5,565 | $293,420 | $32,681 | $260,739 |
| 2022 | $6,008 | $252,710 | $32,681 | $220,029 |
| 2021 | $5,563 | $220,934 | $32,681 | $188,253 |
| 2020 | $5,311 | $192,980 | $29,631 | $163,349 |
| 2019 | $5,436 | $190,034 | $29,631 | $160,403 |
| 2018 | $2,398 | $171,746 | $29,631 | $142,115 |
| 2017 | $4,593 | $157,113 | $21,788 | $135,325 |
| 2016 | $4,261 | $145,748 | $17,430 | $128,318 |
| 2015 | $3,690 | $133,981 | $14,162 | $119,819 |
| 2014 | $3,690 | $117,963 | $10,894 | $107,069 |
Source: Public Records
Map
Nearby Homes
- 909 Pennygent Ln
- 1123 Maclesby Ln
- 1343 Littleport Ln
- 1102 Heathfield Dr
- 1034 Littleport Ln
- 1323 Padstow Ln
- 14951 Scotter Dr
- 14918 Silver Green Dr S
- 1330 Stevenage Ln
- 1315 Goswell Ln
- 15122 Sheffield Terrace
- 14835 Scotter Dr
- 15223 Bedford Glen Dr
- 1130 Fairlane Square
- 15262 Mincing Ln
- 1502 Stevenage Ln
- 1303 Sterling Green Ct
- 14806 Beaconsfield Dr
- 827 Dondell St
- 15307 Streatham Cir
- 15121 Elstree Dr
- 15119 Elstree Dr
- 15129 Elstree Dr
- 15117 Elstree Dr
- 15131 Elstree Dr
- 15122 Elstree Dr
- 15120 Elstree Dr
- 15126 Elstree Dr
- 15118 Elstree Dr
- 15115 Elstree Dr
- 15128 Elstree Dr
- 15116 Elstree Dr
- 15130 Elstree Dr
- 15113 Elstree Dr
- 1311 Littleport Ln
- 15114 Elstree Dr
- 15132 Elstree Dr
- 15135 Elstree Dr
- 1175 Holbech Ln
- 1310 Littleport Ln