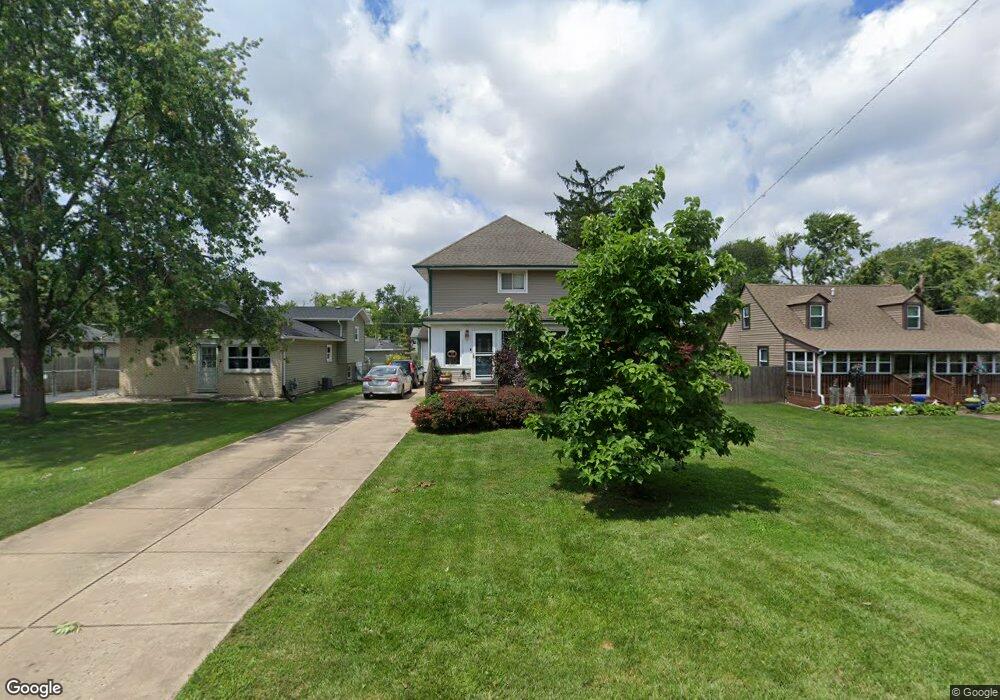
15128 La Crosse Ave Oak Forest, IL 60452
Estimated Value: $324,000 - $433,000
4
Beds
4
Baths
1,536
Sq Ft
$229/Sq Ft
Est. Value
About This Home
This home is located at 15128 La Crosse Ave, Oak Forest, IL 60452 and is currently estimated at $352,382, approximately $229 per square foot. 15128 La Crosse Ave is a home located in Cook County with nearby schools including Kerkstra Elementary School, Jack Hille Middle School, and Oak Forest High School.
Ownership History
Date
Name
Owned For
Owner Type
Purchase Details
Closed on
Jul 14, 2009
Sold by
Vanmersbergen Jennifer Hamm and Vanmersbergen Guy C
Bought by
Finn Eileen and Baran Kathy M
Current Estimated Value
Home Financials for this Owner
Home Financials are based on the most recent Mortgage that was taken out on this home.
Original Mortgage
$213,600
Outstanding Balance
$140,257
Interest Rate
5.43%
Mortgage Type
Unknown
Estimated Equity
$212,125
Purchase Details
Closed on
Dec 20, 2005
Sold by
Koleczek John and Koleczek Anne
Bought by
Vanmersbergen Jennifer Hamm
Home Financials for this Owner
Home Financials are based on the most recent Mortgage that was taken out on this home.
Original Mortgage
$256,500
Interest Rate
6.42%
Mortgage Type
Fannie Mae Freddie Mac
Purchase Details
Closed on
Jun 13, 2001
Sold by
Massty Cleopha F
Bought by
Koleczek John and Koleczek Ann
Create a Home Valuation Report for This Property
The Home Valuation Report is an in-depth analysis detailing your home's value as well as a comparison with similar homes in the area
Home Values in the Area
Average Home Value in this Area
Purchase History
| Date | Buyer | Sale Price | Title Company |
|---|---|---|---|
| Finn Eileen | $267,000 | Cti | |
| Vanmersbergen Jennifer Hamm | $285,000 | Atgf Inc | |
| Koleczek John | $110,000 | -- |
Source: Public Records
Mortgage History
| Date | Status | Borrower | Loan Amount |
|---|---|---|---|
| Open | Finn Eileen | $213,600 | |
| Previous Owner | Vanmersbergen Jennifer Hamm | $256,500 |
Source: Public Records
Tax History Compared to Growth
Tax History
| Year | Tax Paid | Tax Assessment Tax Assessment Total Assessment is a certain percentage of the fair market value that is determined by local assessors to be the total taxable value of land and additions on the property. | Land | Improvement |
|---|---|---|---|---|
| 2024 | $6,472 | $24,000 | $3,780 | $20,220 |
| 2023 | $5,949 | $24,000 | $3,780 | $20,220 |
| 2022 | $5,949 | $17,589 | $3,308 | $14,281 |
| 2021 | $5,838 | $17,588 | $3,307 | $14,281 |
| 2020 | $5,703 | $17,588 | $3,307 | $14,281 |
| 2019 | $6,141 | $18,675 | $3,071 | $15,604 |
| 2018 | $6,035 | $18,675 | $3,071 | $15,604 |
| 2017 | $7,420 | $18,675 | $3,071 | $15,604 |
| 2016 | $6,663 | $16,216 | $2,598 | $13,618 |
| 2015 | $6,503 | $16,216 | $2,598 | $13,618 |
| 2014 | $6,314 | $16,216 | $2,598 | $13,618 |
| 2013 | $6,554 | $18,774 | $2,598 | $16,176 |
Source: Public Records
Map
Nearby Homes
- 15117 La Crosse Ave
- 15115 Cicero Ave
- 15240 Laporte Ave
- 14913 Sheila Ct
- 14845 Cicero Ave
- 15302 Kenton Ave Unit 3
- 14926 Kenton Ave
- 5117 154th St
- 14819 Anne Ct
- 14840 Kilpatrick Ave Unit 604
- 5218 Laramie Ct
- 15407 Kenton Ave
- 15231 Kilbourne Ave
- 14951 Kilbourne Ave
- 5313 Crescent Green Ln
- 5028 156th St
- 14815 Kenton Ave Unit 1
- 5237 Diamond Dr Unit B
- 15100 Kostner Ave
- 15100 Crescent Green Dr
- 15132 La Crosse Ave
- 15120 La Crosse Ave
- 15136 La Crosse Ave
- 15104 La Crosse Ave
- 15133 Laporte Ave
- 15127 Laporte Ave
- 15137 Laporte Ave
- 15140 La Crosse Ave
- 15102 La Crosse Ave
- 15119 Laporte Ave
- 15129 La Crosse Ave
- 15139 Laporte Ave
- 4841 151st St
- 15133 La Crosse Ave
- 15100 La Crosse Ave
- 15115 La Crosse Ave
- 15143 Laporte Ave
- 15137 La Crosse Ave
- 15103 La Crosse Ave
- 15141 La Crosse Ave