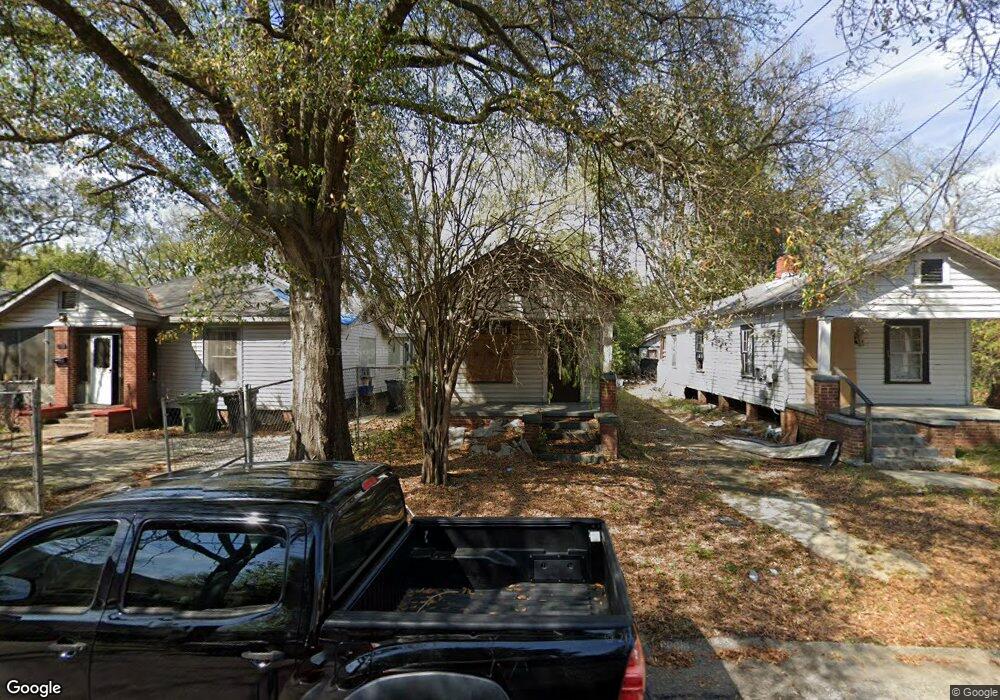
1513 27th St Columbus, GA 31901
East Highlands NeighborhoodEstimated Value: $56,000 - $101,000
1
Bed
1
Bath
633
Sq Ft
$120/Sq Ft
Est. Value
About This Home
This home is located at 1513 27th St, Columbus, GA 31901 and is currently estimated at $75,664, approximately $119 per square foot. 1513 27th St is a home located in Muscogee County with nearby schools including Hannan Elementary School, Arnold Middle School, and Jordan Vocational High School.
Ownership History
Date
Name
Owned For
Owner Type
Purchase Details
Closed on
Apr 19, 2021
Sold by
Evergreen Property Acquisitions Llc
Bought by
Dor Infinity Investments Lllp
Current Estimated Value
Purchase Details
Closed on
Jun 15, 2020
Sold by
Lewis Enos
Bought by
Evergreen Property Acquisitions Llc
Purchase Details
Closed on
Mar 8, 2012
Sold by
Britt John L
Bought by
Westmoreland Companies Llc
Create a Home Valuation Report for This Property
The Home Valuation Report is an in-depth analysis detailing your home's value as well as a comparison with similar homes in the area
Home Values in the Area
Average Home Value in this Area
Purchase History
| Date | Buyer | Sale Price | Title Company |
|---|---|---|---|
| Dor Infinity Investments Lllp | $17,000 | -- | |
| Evergreen Property Acquisitions Llc | -- | -- | |
| Lewis Enos | $22,500 | -- | |
| Westmoreland Companies Llc | $17,500 | -- |
Source: Public Records
Tax History Compared to Growth
Tax History
| Year | Tax Paid | Tax Assessment Tax Assessment Total Assessment is a certain percentage of the fair market value that is determined by local assessors to be the total taxable value of land and additions on the property. | Land | Improvement |
|---|---|---|---|---|
| 2025 | $116 | $29,728 | $4,632 | $25,096 |
| 2024 | $1,164 | $29,728 | $4,632 | $25,096 |
| 2023 | $1,171 | $29,728 | $4,632 | $25,096 |
| 2022 | $234 | $5,731 | $4,632 | $1,099 |
| 2021 | $388 | $8,572 | $4,632 | $3,940 |
| 2020 | $584 | $14,304 | $4,632 | $9,672 |
| 2019 | $240 | $5,860 | $1,465 | $4,395 |
| 2018 | $240 | $5,860 | $1,465 | $4,395 |
| 2017 | $241 | $5,860 | $1,465 | $4,395 |
| 2016 | $261 | $6,336 | $700 | $5,636 |
| 2015 | $262 | $6,336 | $700 | $5,636 |
| 2014 | $262 | $6,336 | $700 | $5,636 |
| 2013 | -- | $6,336 | $700 | $5,636 |
Source: Public Records
Map
Nearby Homes