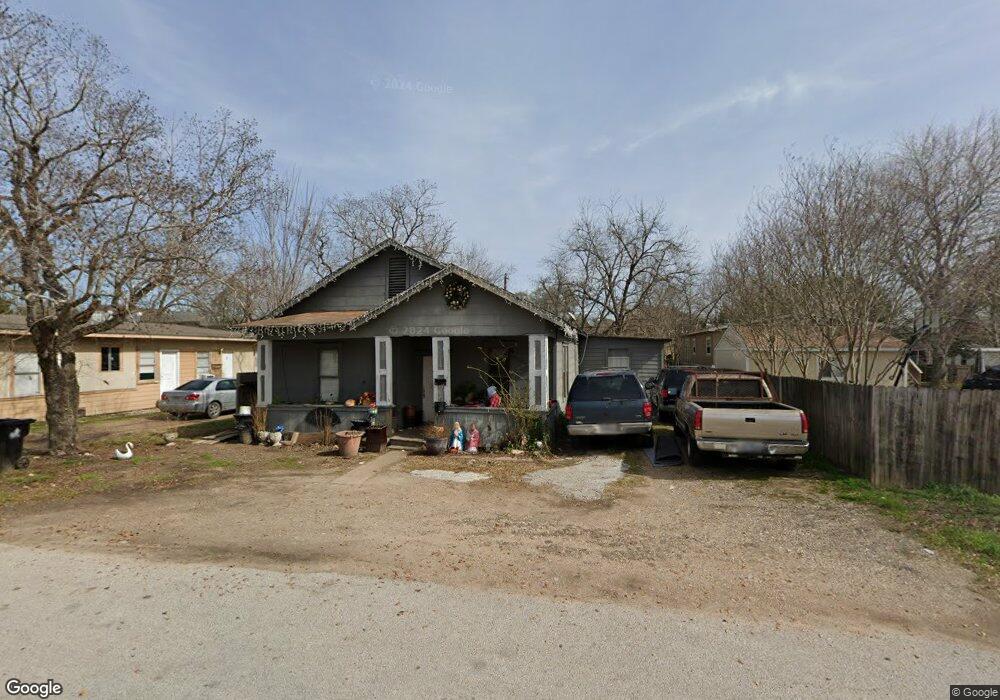
1513 5th St Rosenberg, TX 77471
Estimated Value: $184,532 - $244,000
3
Beds
1
Bath
1,479
Sq Ft
$142/Sq Ft
Est. Value
About This Home
This home is located at 1513 5th St, Rosenberg, TX 77471 and is currently estimated at $209,511, approximately $141 per square foot. 1513 5th St is a home located in Fort Bend County with nearby schools including Taylor Ray Elementary School, Navarro Middle School, and George Junior High School.
Ownership History
Date
Name
Owned For
Owner Type
Purchase Details
Closed on
Apr 21, 2014
Sold by
Olivo Victor M
Bought by
Rodriguez Juvenal Vera and Rodriguez Celia Gonzalez
Current Estimated Value
Purchase Details
Closed on
Jul 16, 2010
Sold by
Olivio Victor F
Bought by
Olivo Victor M
Purchase Details
Closed on
Sep 8, 2005
Sold by
Davila Samuel and Davila Belinda
Bought by
Olivio Victor F and Olivo Dawn
Home Financials for this Owner
Home Financials are based on the most recent Mortgage that was taken out on this home.
Original Mortgage
$53,100
Interest Rate
10.65%
Mortgage Type
Fannie Mae Freddie Mac
Purchase Details
Closed on
May 2, 2001
Sold by
Davila Manuel and Davila Maria
Bought by
Davila Samuel and Davila Belinda
Home Financials for this Owner
Home Financials are based on the most recent Mortgage that was taken out on this home.
Original Mortgage
$28,000
Interest Rate
7.07%
Mortgage Type
Seller Take Back
Create a Home Valuation Report for This Property
The Home Valuation Report is an in-depth analysis detailing your home's value as well as a comparison with similar homes in the area
Home Values in the Area
Average Home Value in this Area
Purchase History
| Date | Buyer | Sale Price | Title Company |
|---|---|---|---|
| Rodriguez Juvenal Vera | -- | None Available | |
| Olivo Victor M | -- | Startex Title Company | |
| Rodriguez Celia | -- | -- | |
| Olivio Victor F | -- | Stewart Title Fort Bend Div | |
| Rodriguez Celia | -- | -- | |
| Davila Samuel | -- | -- |
Source: Public Records
Mortgage History
| Date | Status | Borrower | Loan Amount |
|---|---|---|---|
| Previous Owner | Rodriguez Celia | $53,100 | |
| Previous Owner | Davila Samuel | $28,000 |
Source: Public Records
Tax History Compared to Growth
Tax History
| Year | Tax Paid | Tax Assessment Tax Assessment Total Assessment is a certain percentage of the fair market value that is determined by local assessors to be the total taxable value of land and additions on the property. | Land | Improvement |
|---|---|---|---|---|
| 2025 | $2,947 | $127,506 | $61,534 | $65,972 |
| 2024 | $2,947 | $175,129 | $61,534 | $113,595 |
| 2023 | $2,510 | $130,000 | $47,701 | $82,299 |
| 2022 | $2,637 | $128,760 | $47,700 | $81,060 |
| 2021 | $1,912 | $92,150 | $43,520 | $48,630 |
| 2020 | $1,929 | $90,910 | $42,920 | $47,990 |
| 2019 | $1,699 | $74,370 | $26,150 | $48,220 |
| 2018 | $1,600 | $68,940 | $26,150 | $42,790 |
| 2017 | $1,359 | $58,220 | $26,150 | $32,070 |
| 2016 | $1,211 | $51,890 | $26,150 | $25,740 |
| 2015 | $1,000 | $42,640 | $26,150 | $16,490 |
| 2014 | $1,226 | $51,620 | $26,150 | $25,470 |
Source: Public Records
Map
Nearby Homes
- 1517 4th St
- 1401 5th St
- 1030 4th St
- 1410 8th St
- 2513 3rd St
- 2409 Avenue K
- 1314 2nd St
- 2717 Parrott Ave
- 1314 1st St
- 905 5th St
- 901 5th St
- 1004 Houston St
- 1108 Macarthur St
- 2606 Wastelbread Ln
- 2523 Good Morrow Dr
- 2527 Good Morrow Dr
- 2622 Good Morrow Dr
- 2507 Good Morrow Dr
- 2614 Good Morrow Dr
- 1212 Alamo St